

Question: Homework: Set - Prerequisite Week 7 Homework Question 15, IR.10.70 HW Score: 46.67%, 7 of 15 points Part 1 of 4 O Points: 0 of
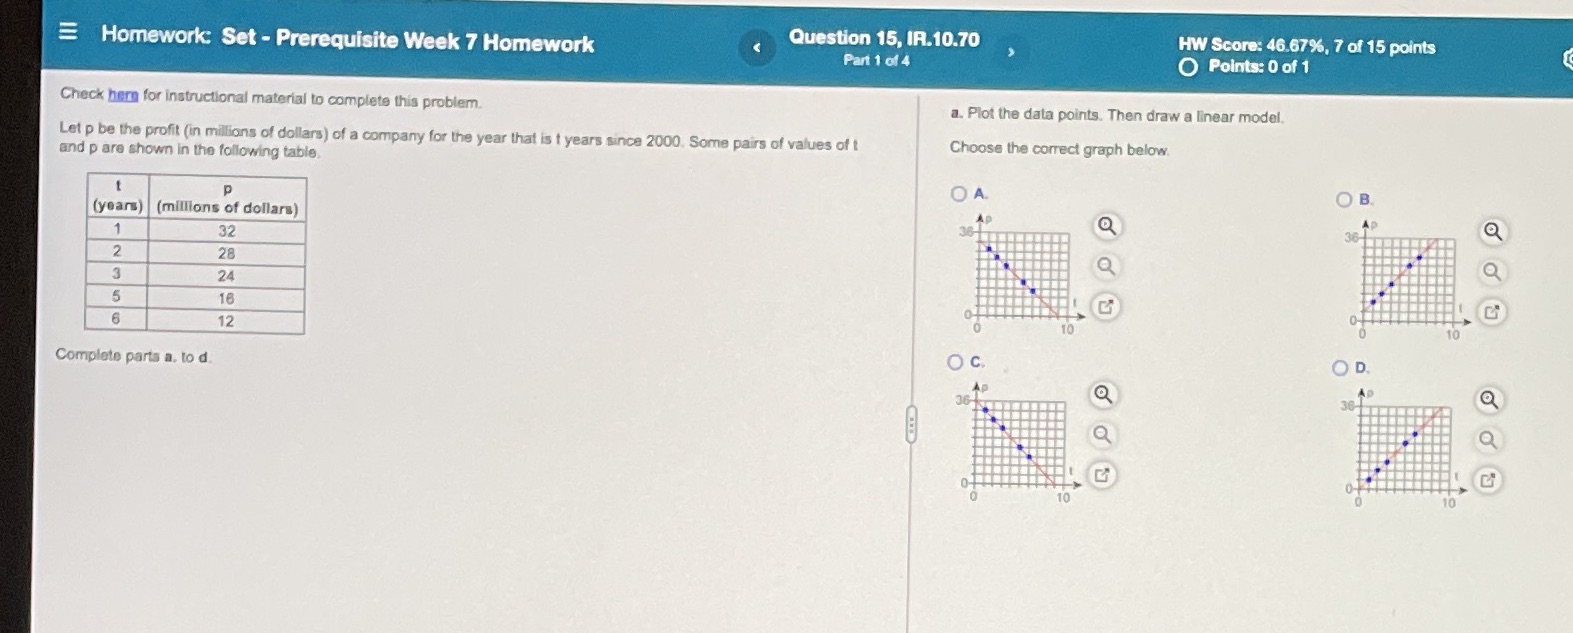
Homework: Set - Prerequisite Week 7 Homework Question 15, IR.10.70 HW Score: 46.67%, 7 of 15 points Part 1 of 4 O Points: 0 of 1 Check here for instructional material to complete this problem. a. Plot the data points. Then draw a linear model. Let p be the profit (in millions of dollars) of a company for the year that is t years since 2000. Some pairs of values of t Choose the correct graph below. and p are shown in the following table. O A. O B (years) (millions of dollars) 36- 32 2 28 3 24 5 16 Ci 6 12 10 10 Complete parts a, to d O c. OD Q Ci
Step by Step Solution
There are 3 Steps involved in it
1 Expert Approved Answer
Step: 1 Unlock

Question Has Been Solved by an Expert!
Get step-by-step solutions from verified subject matter experts
Step: 2 Unlock
Step: 3 Unlock