

Question: Homework: Supply and Demand: An Initial Look The following graph shows the market for cakes in Detroit, where there are over a thousand bakeries at
Homework: Supply and Demand: An Initial Look
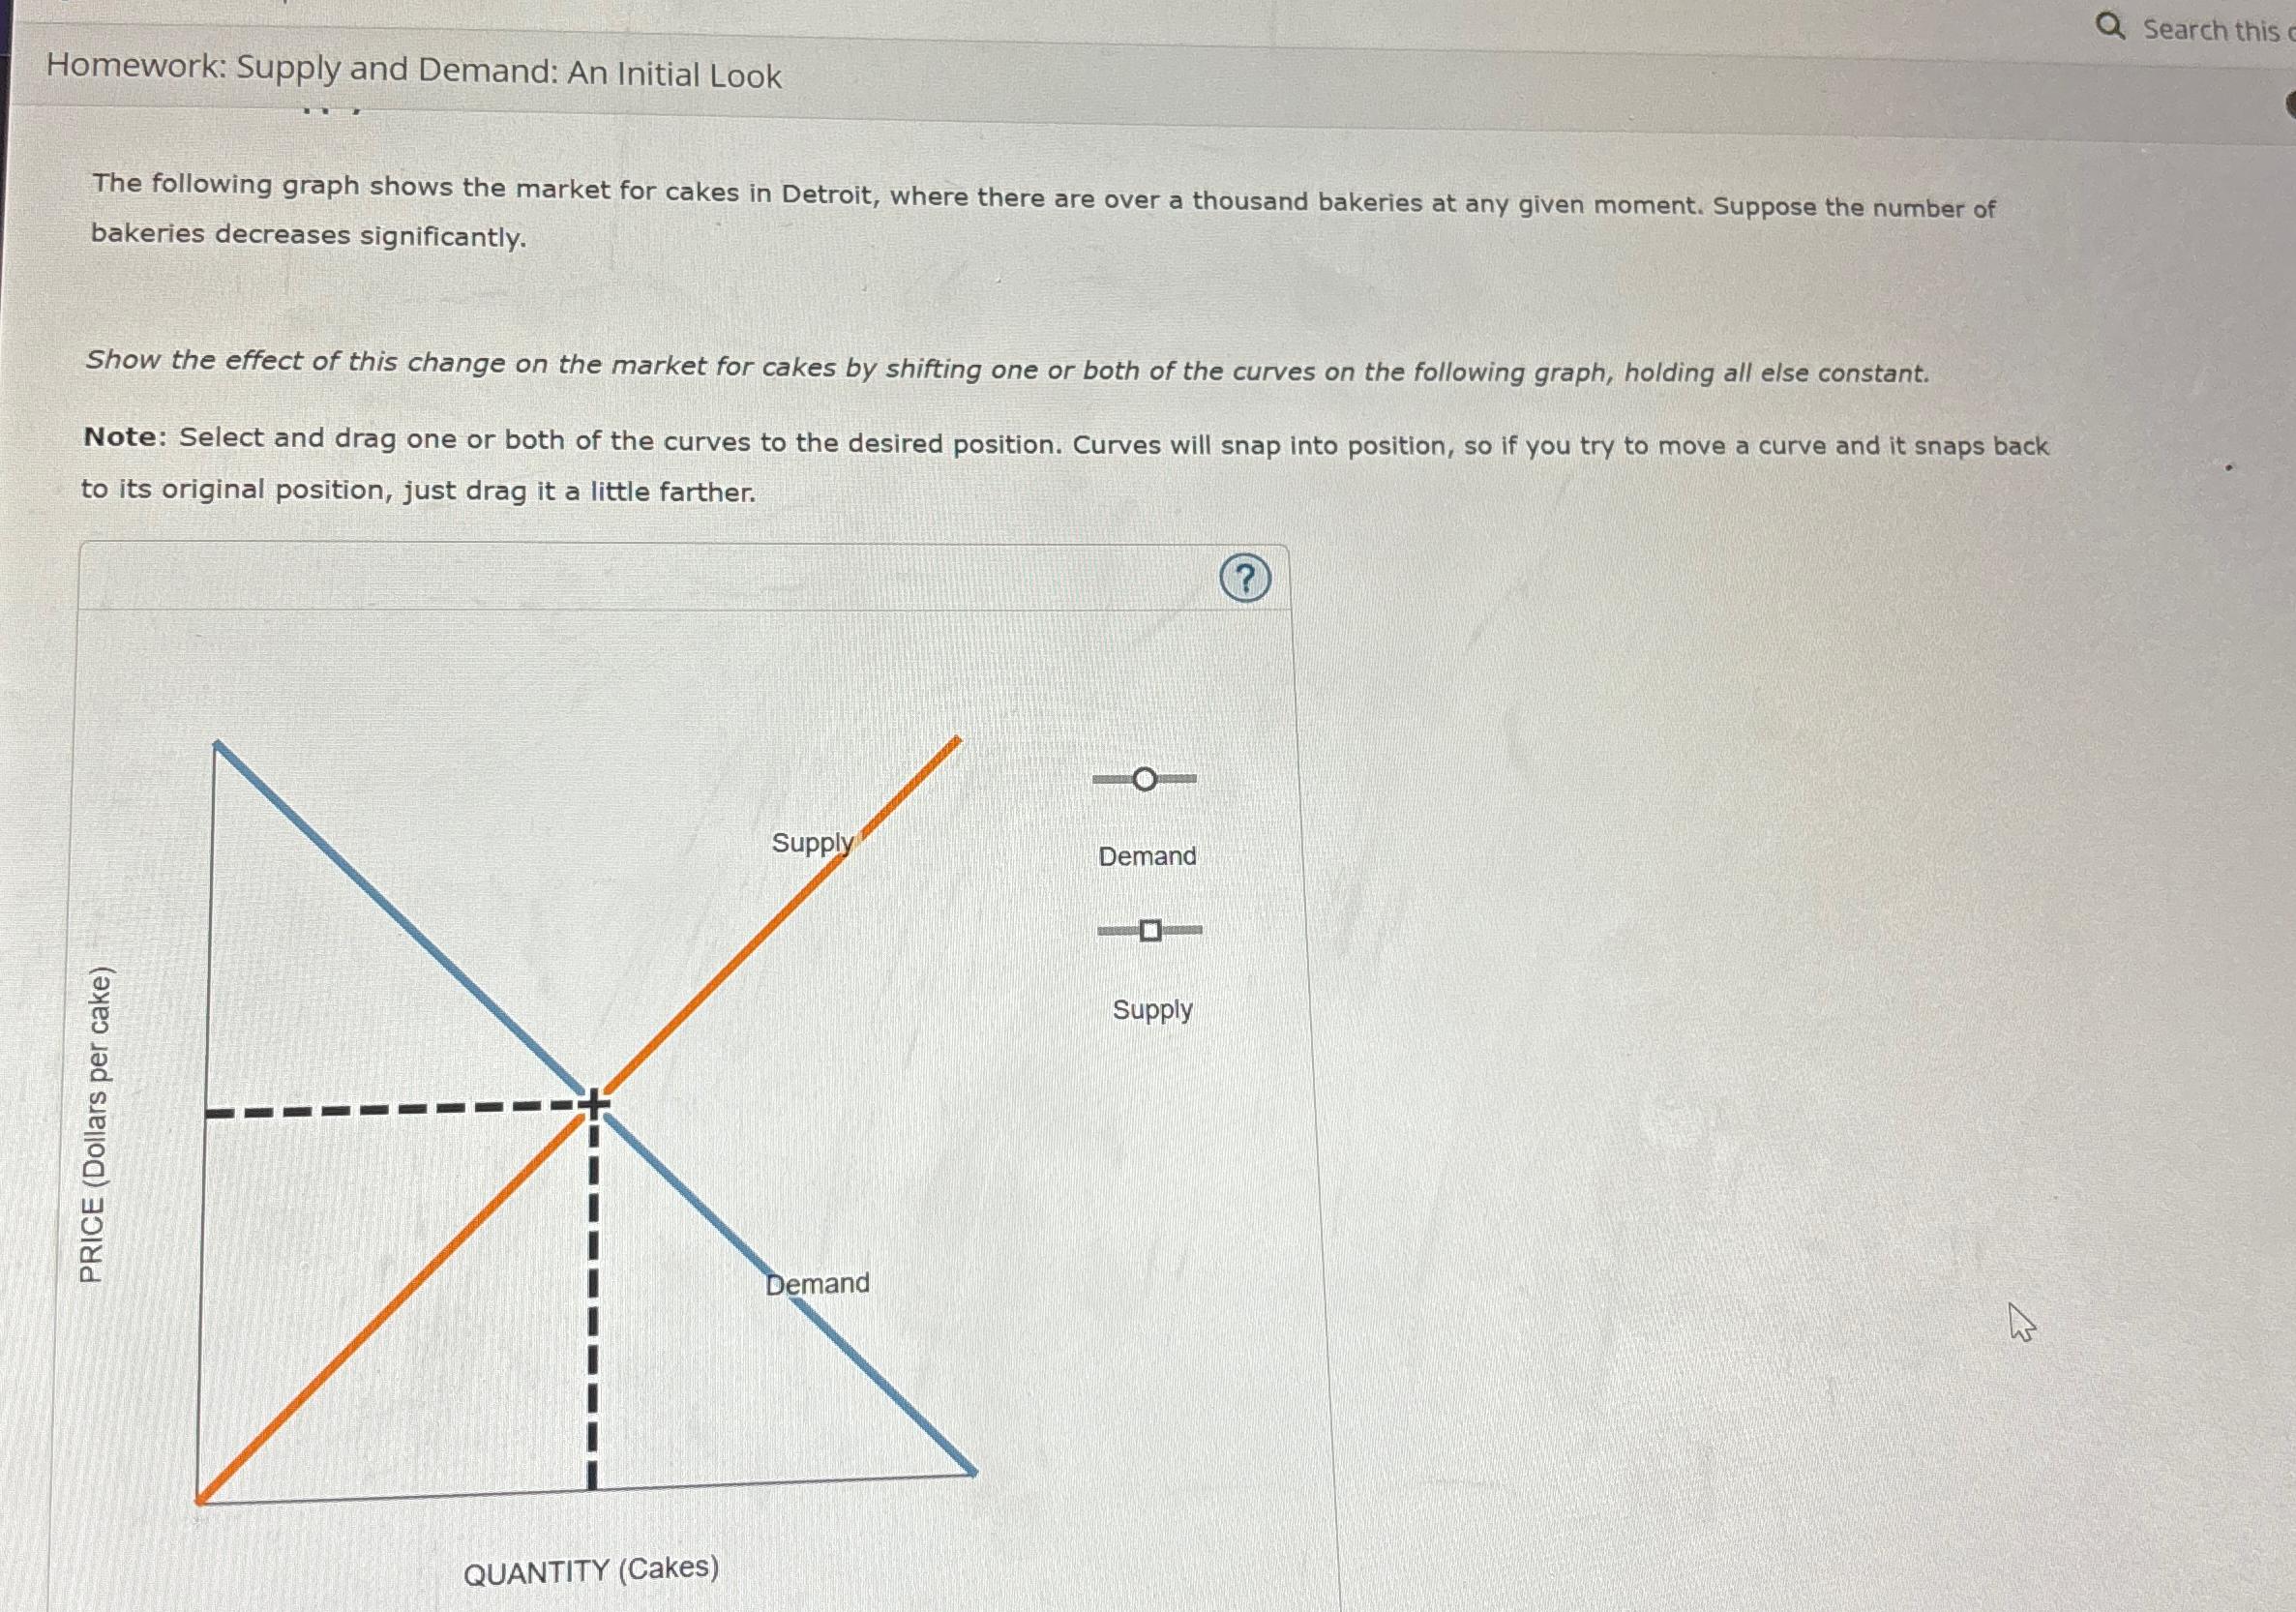
The following graph shows the market for cakes in Detroit, where there are over a thousand bakeries at any given moment. Suppose the number of bakeries decreases significantly.
Show the effect of this change on the market for cakes by shifting one or both of the curves on the following graph, holding all else constant.
Note: Select and drag one or both of the curves to the desired position. Curves will snap into position, so if you try to move a curve and it snaps back to its original position, just drag it a little farther.
Search this
Step by Step Solution
There are 3 Steps involved in it
1 Expert Approved Answer
Step: 1 Unlock

Question Has Been Solved by an Expert!
Get step-by-step solutions from verified subject matter experts
Step: 2 Unlock
Step: 3 Unlock