

Question: Attempts: Keep the Highest: / 1 9. Shifts in supply or demand II The following graph shows the market for croissants in Philadelphia, where there
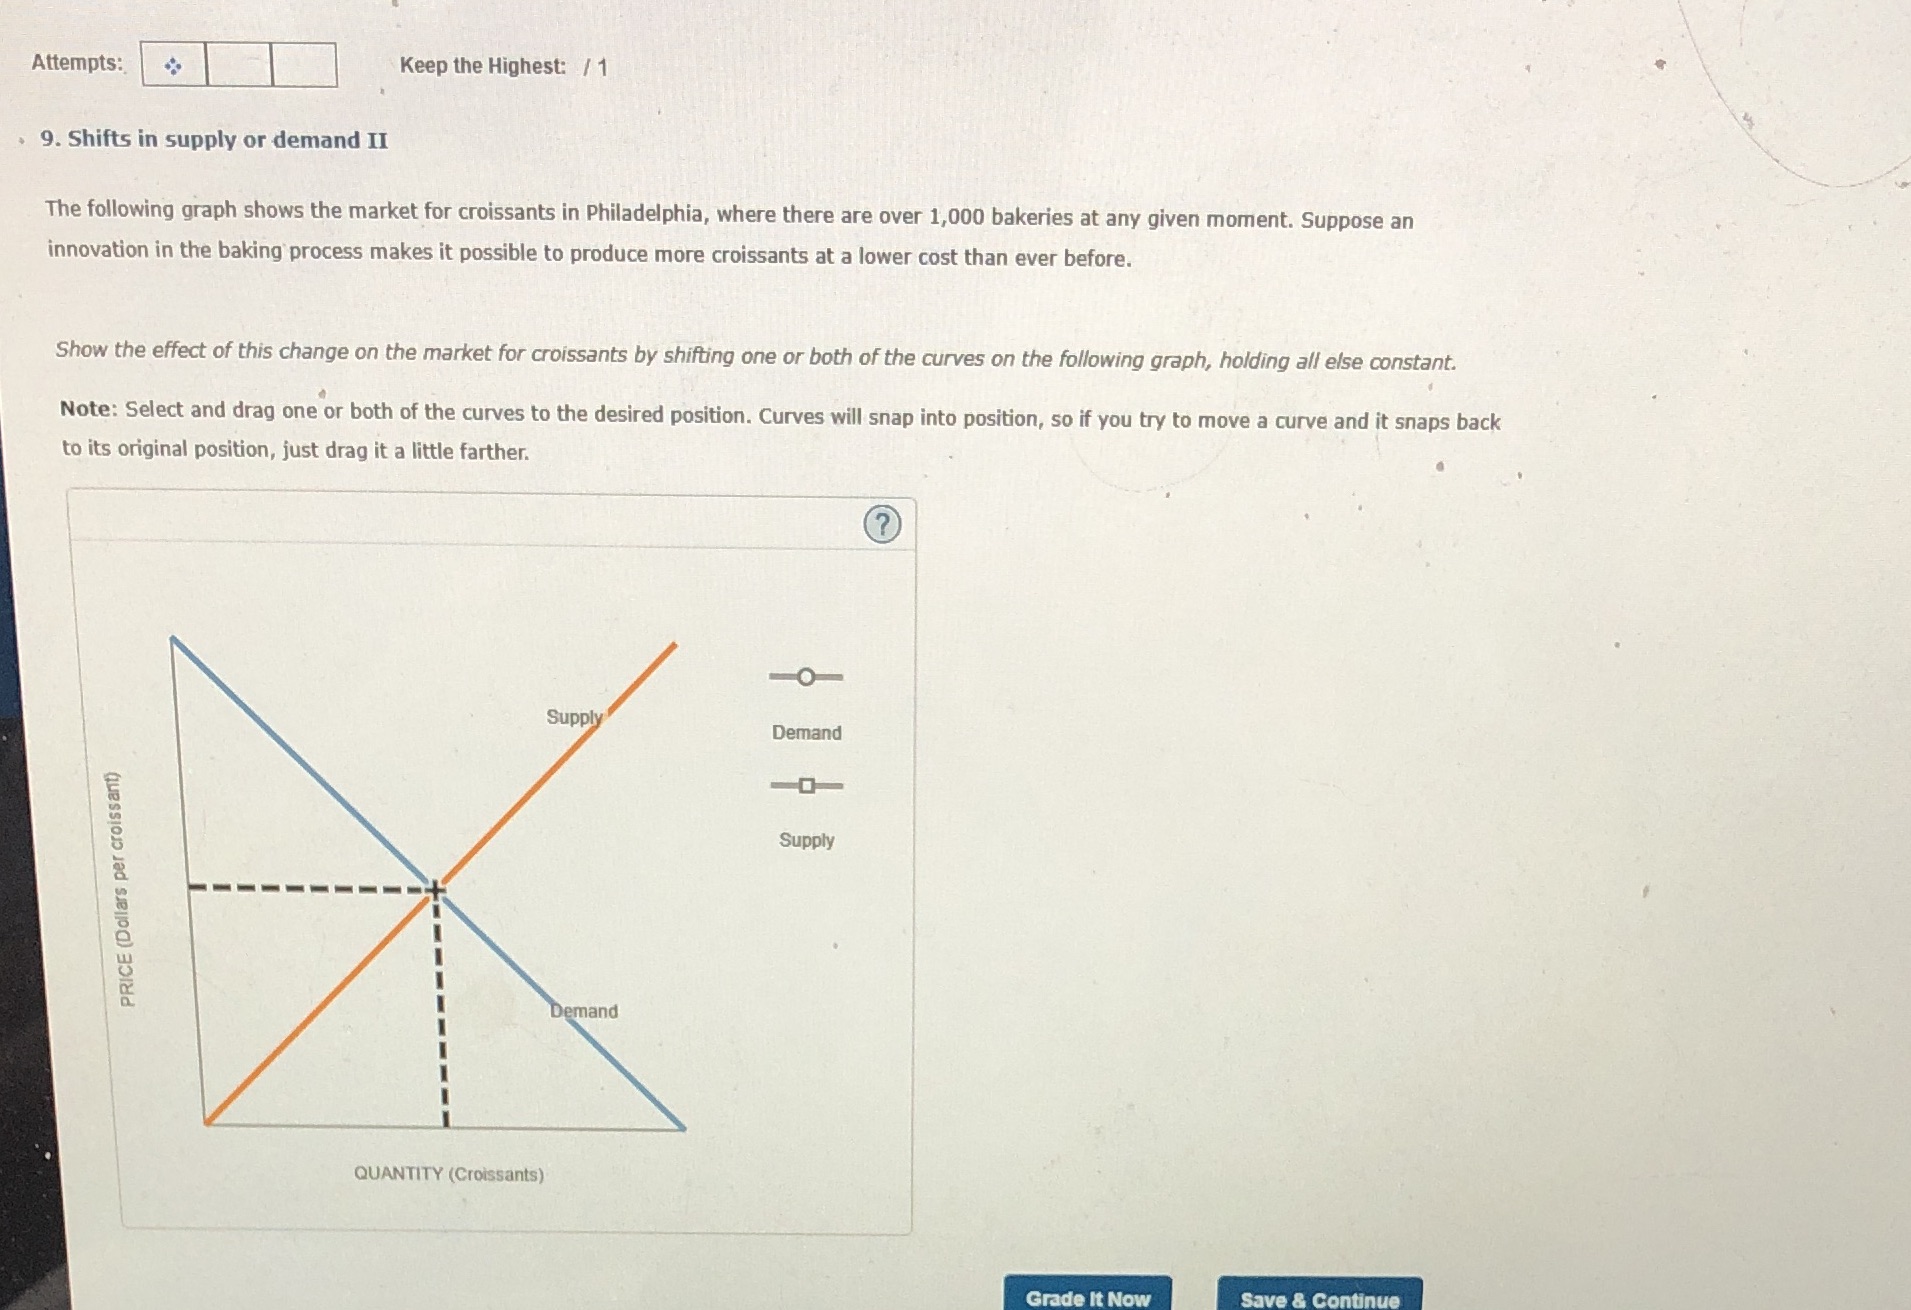
Attempts: Keep the Highest: / 1 9. Shifts in supply or demand II The following graph shows the market for croissants in Philadelphia, where there are over 1,000 bakeries at any given moment. Suppose an innovation in the baking process makes it possible to produce more croissants at a lower cost than ever before. Show the effect of this change on the market for croissants by shifting one or both of the curves on the following graph, holding all else constant. Note: Select and drag one or both of the curves to the desired position. Curves will snap into position, so if you try to move a curve and it snaps back to its original position, just drag it a little farther. Supply Demand Supply PRICE (Dollars per croissant) Demand QUANTITY (Croissants) Grade It Now Save & Continue
Step by Step Solution
There are 3 Steps involved in it

Get step-by-step solutions from verified subject matter experts