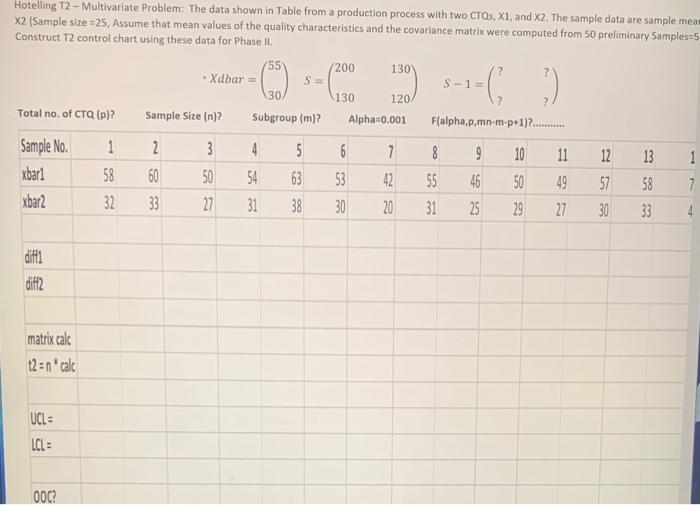
Question: Hoteling T - Multivariate Problem: The data shown in Table from a production process with two CTOs,X1, and X2. The sample data are sample mea

Hoteling T - Multivariate Problem: The data shown
Hoteling T - Multivariate Problem: The data shown in Table from a production process with two CTOs,X1, and X2. The sample data are sample mea X2. (Sample size =25, Assume that mean values of the quality characteristics and the covariance matrix were computed from 50 preliminary Samples=5 Construct 12 control chart using these data for Phase II. Xdbar=(5530)S=(200130130120)S1=(????) diffl difiti matrix calc t2=n2calc UCl= LCl= 000

Step by Step Solution

There are 3 Steps involved in it

1 Expert Approved Answer
Step: 1 Unlock blur-text-image
Question Has Been Solved by an Expert!

Get step-by-step solutions from verified subject matter experts

Step: 2 Unlock
Step: 3 Unlock

Students Have Also Explored These Related General Management Questions!