

Question: Hotelling T2 Multivariate Problem: The data shown in Table from a production process with two CTQs, X1, and X2. The sample data are sample means
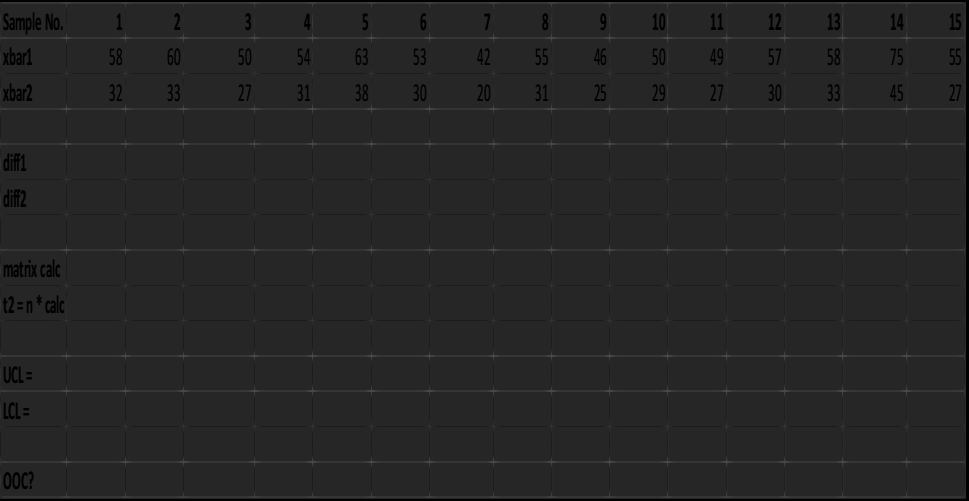
Hotelling T2 Multivariate Problem: The data shown in Table from a production process with two CTQs, X1, and X2. The sample data are sample means of X1 and X2 (Sample size =25, Assume that mean values of the quality characteristics and the covariance matrix were computed from 50 preliminary Samples=50). Construct T2 control chart using these data for Phase II.
Xdbar=5530 S=200130130120 S-1=????
Total no. of CTQ (p)? Sample Size (n)? Subgroup (m)? Alpha=0.001 F(alpha,p,mn-m-p+1)?...........
Conclusion?
Please show work
\begin{tabular}{|l|rrrrrrrrrrrrrrr} Sample No. & 1 & 2 & 3 & 4 & 5 & 6 & 7 & 8 & 9 & 10 & 11 & 12 & 13 & 14 & 15 \\ \hline xbar1 & 58 & 60 & 50 & 54 & 63 & 53 & 42 & 55 & 46 & 50 & 49 & 57 & 58 & 75 & 55 \\ \hline xbar2 & 32 & 33 & 27 & 31 & 38 & 30 & 20 & 31 & 25 & 29 & 27 & 30 & 33 & 45 & 27 \end{tabular}Step by Step Solution
There are 3 Steps involved in it
1 Expert Approved Answer
Step: 1 Unlock

Question Has Been Solved by an Expert!
Get step-by-step solutions from verified subject matter experts
Step: 2 Unlock
Step: 3 Unlock