Question: House Type Analysis You will analyze each house type to determine if the company has a tendency to purchase a certain type of a house.
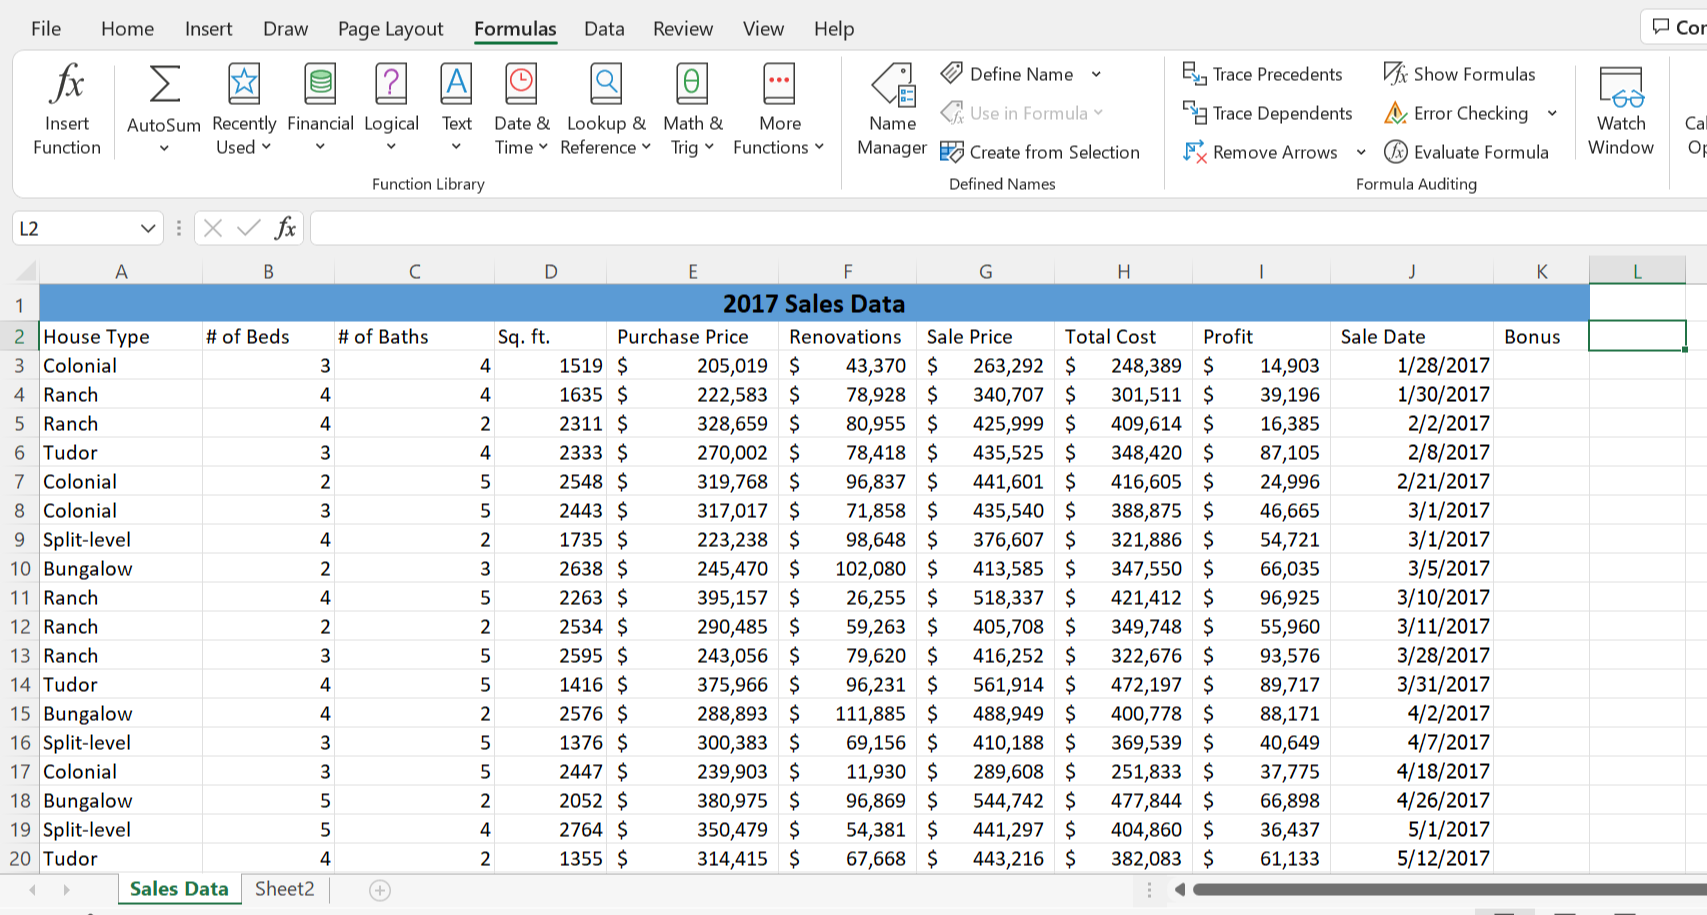
House Type Analysis You will analyze each house type to determine if the company has a tendency to purchase a certain type of a house. p. Create a 2D-Pie chart that displays the total number of houses by house type and apply chart type Style 7. q. Move the chart to the left side of the screen directly under the table data. r. Change the chart title to House Type. S. Move the legend to the top-left corner. t. Explode the largest piece of the pie to a Point Explosion of 20% u. Add Data Callout data labels to the chart. File Home Insert Draw Page Layout Formulas Data Review View Help Cor Define Name fx Text Insert Function AutoSum Recently Financial Logical Used Date & Lookup & Math & More Time Reference Trig Functions Name Use in Formula Manager Create from Selection Ey Trace Precedents x Show Formulas Fa Trace Dependents Error Checking FRemove Arrows Evaluate Formula Formula Auditing GO Watch Window Cal Or Function Library Defined Names L2 1 X fx B K Sq. ft. Bonus 4 4 2 4 5 5 2 NA 3 1 2 House Type # of Beds # of Baths 3 Colonial 3 4 Ranch 4 5 Ranch 4 6 Tudor 3 7 Colonial 2 8 Colonial 3 9 Split-level 4 10 Bungalow 2 11 Ranch 4 12 Ranch 2 13 Ranch 3 14 Tudor 4 15 Bungalow 4 16 Split-level 3 17 Colonial 3 18 Bungalow 5 19 Split-level 5 20 Tudor 4 Sales Data Sheet2 D E F H 2017 Sales Data Purchase Price Renovations Sale Price Total Cost Profit 1519 $ 205,019 $ 43,370 $ 263,292 $ 248,389 $ 14,903 1635 $ 222,583 $ 78,928 $ 340,707 $ 301,511 $ 39,196 2311 $ 328,659 $ 80,955 $ 425,999 $ 409,614 $ 16,385 2333 $ 270,002 $ 78,418 $ 435,525 $ 348,420 $ 87,105 2548 $ 319,768 $ 96,837 $ 441,601 $ 416,605 $ 24,996 2443 $ 317,017 $ 71,858 $ 435,540 $ 388,875 $ 46,665 1735 $ 223,238 $ 98,648 $ 376,607 $ 321,886 $ 54,721 2638 $ 245,470 $ 102,080 $ 413,585 $ 347,550 $ 66,035 2263 $ 395,157 $ 26,255 $ 518,337 $ 421,412 $ 96,925 2534 $ 290,485 $ 59,263 $ 405,708 $ 349,748 $ 55,960 2595 $ 243,056 $ 79,620 $ 416,252 $ 322,676 $ 93,576 1416 $ 375,966 $ 96,231 $ 561,914 $ 472,197 $ 89,717 2576 $ 288,893 $ 111,885 $ 488,949 $ 400,778 $ 88,171 1376 $ 300,383 $ 69,156 $ 410,188 $ 369,539 $ 40,649 2447 $ 239,903 $ 11,930 $ 289,608 $ 251,833 $ 37,775 2052 $ 380,975 $ 96,869 $ 544,742 $ 477,844 $ 66,898 2764 $ 350,479 $ 54,381 $ 441,297 $ 404,860 $ 36,437 1355 $ 314,415 $ 67,668 $ 443,216 $ 382,083 $ 61,133 5 Sale Date 1/28/2017 1/30/2017 2/2/2017 2/8/2017 2/21/2017 3/1/2017 3/1/2017 3/5/2017 3/10/2017 3/11/2017 3/28/2017 3/31/2017 4/2/2017 4/7/2017 4/18/2017 4/26/2017 5/1/2017 5/12/2017 2 5 5 2 5 5 2 4 2


