

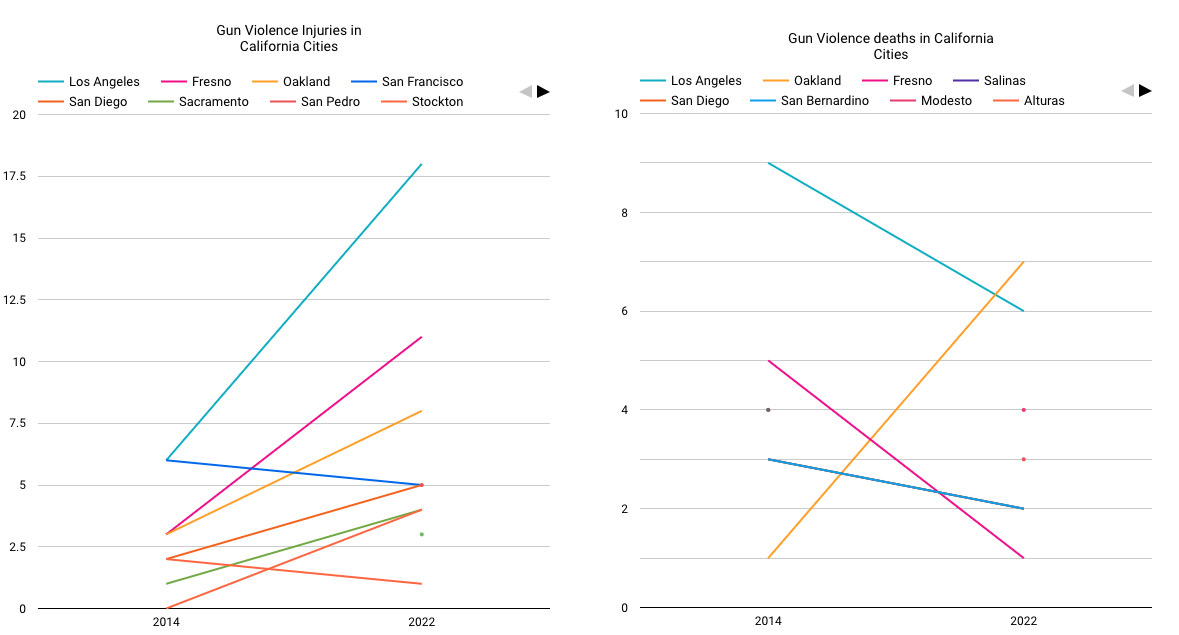
Question: How can I describe the graphs below, which indicate that since California enacted stronger gun rules, the death toll has decreased in comparison to before?
How can I describe the graphs below, which indicate that since California enacted stronger gun rules, the death toll has decreased in comparison to before? And comparing to other states.
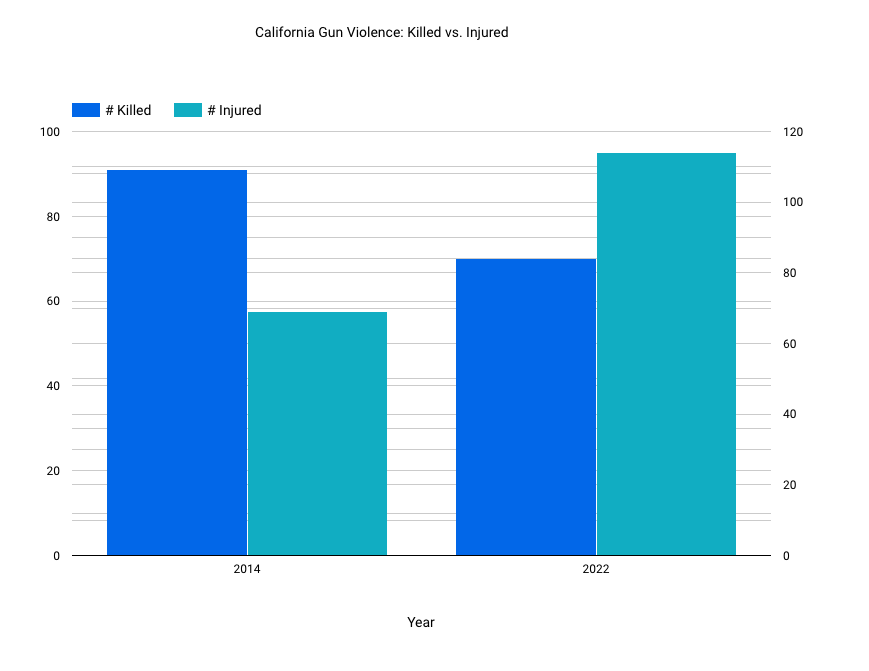
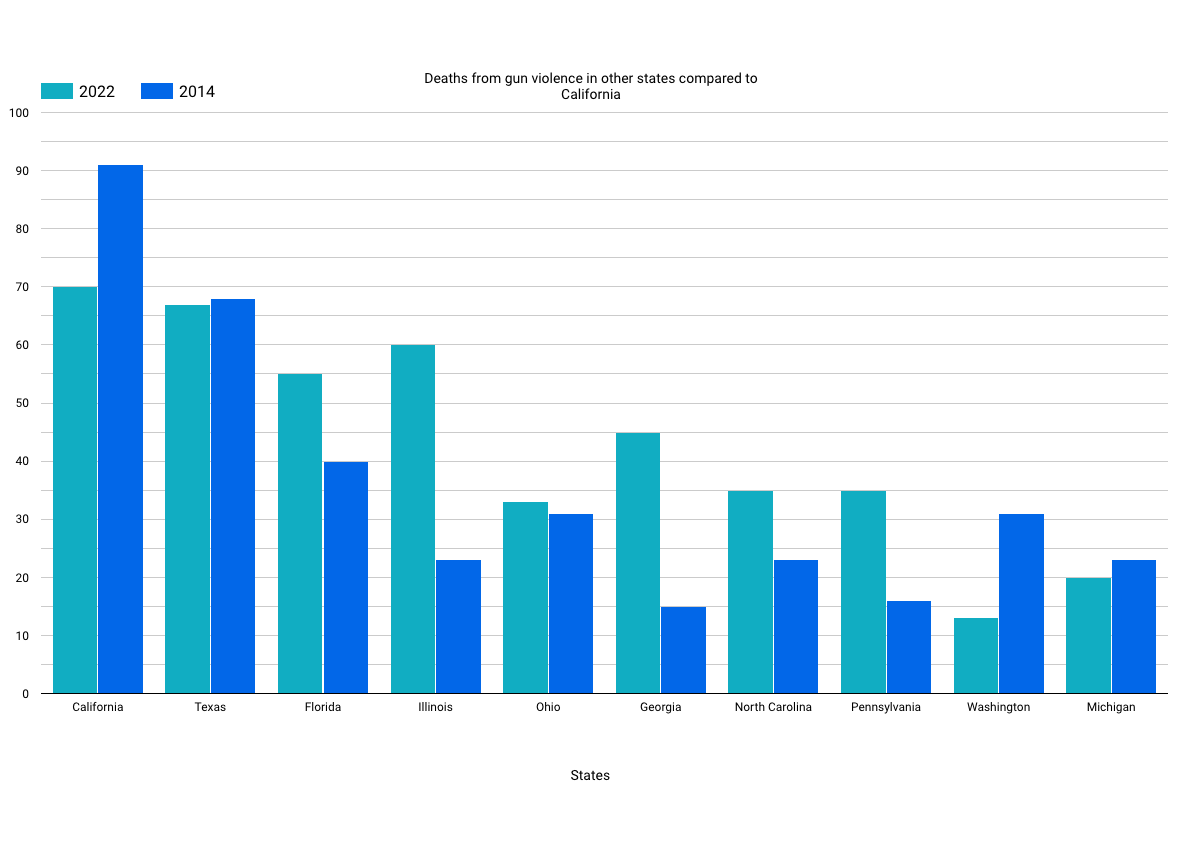
California Gun Violence: Killed vs. Injured # Killed # Injured 100 120 80 100 80 60 60 40 40 20 20 2014 0 2022 Year\f2022 2014 100 Deaths from gun violence in other states compared to California 90 80 70 60 50 40 30 20 10 California Michigan States
Step by Step Solution
There are 3 Steps involved in it
1 Expert Approved Answer
Step: 1 Unlock

Question Has Been Solved by an Expert!
Get step-by-step solutions from verified subject matter experts
Step: 2 Unlock
Step: 3 Unlock