

Question: How can I do the Question a, b, c and d? Thank you. You are shown the following normal probability plot where the data set
How can I do the Question a, b, c and d? Thank you.
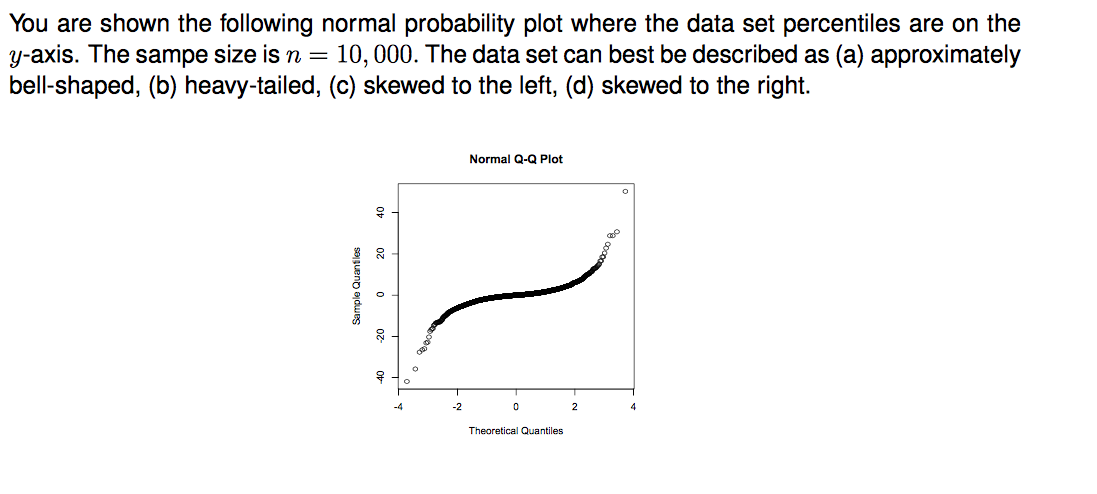
You are shown the following normal probability plot where the data set percentiles are on the y-axis. The sampe size is n = 10, 000. The data set can best be described as (a) approximately bell-shaped, (b) heavy-tailed, (c) skewed to the left, (d) skewed to the right. Normal Q-Q Plot Sample Quantles -2 0 2 Theoretical Quantiles
Step by Step Solution
There are 3 Steps involved in it
1 Expert Approved Answer
Step: 1 Unlock

Question Has Been Solved by an Expert!
Get step-by-step solutions from verified subject matter experts
Step: 2 Unlock
Step: 3 Unlock