

Question: How can I generate the following graph based on the datasets provided? sustainabilityData 1 % > % ggplot ( aes ( x = CarbonFootprint, y
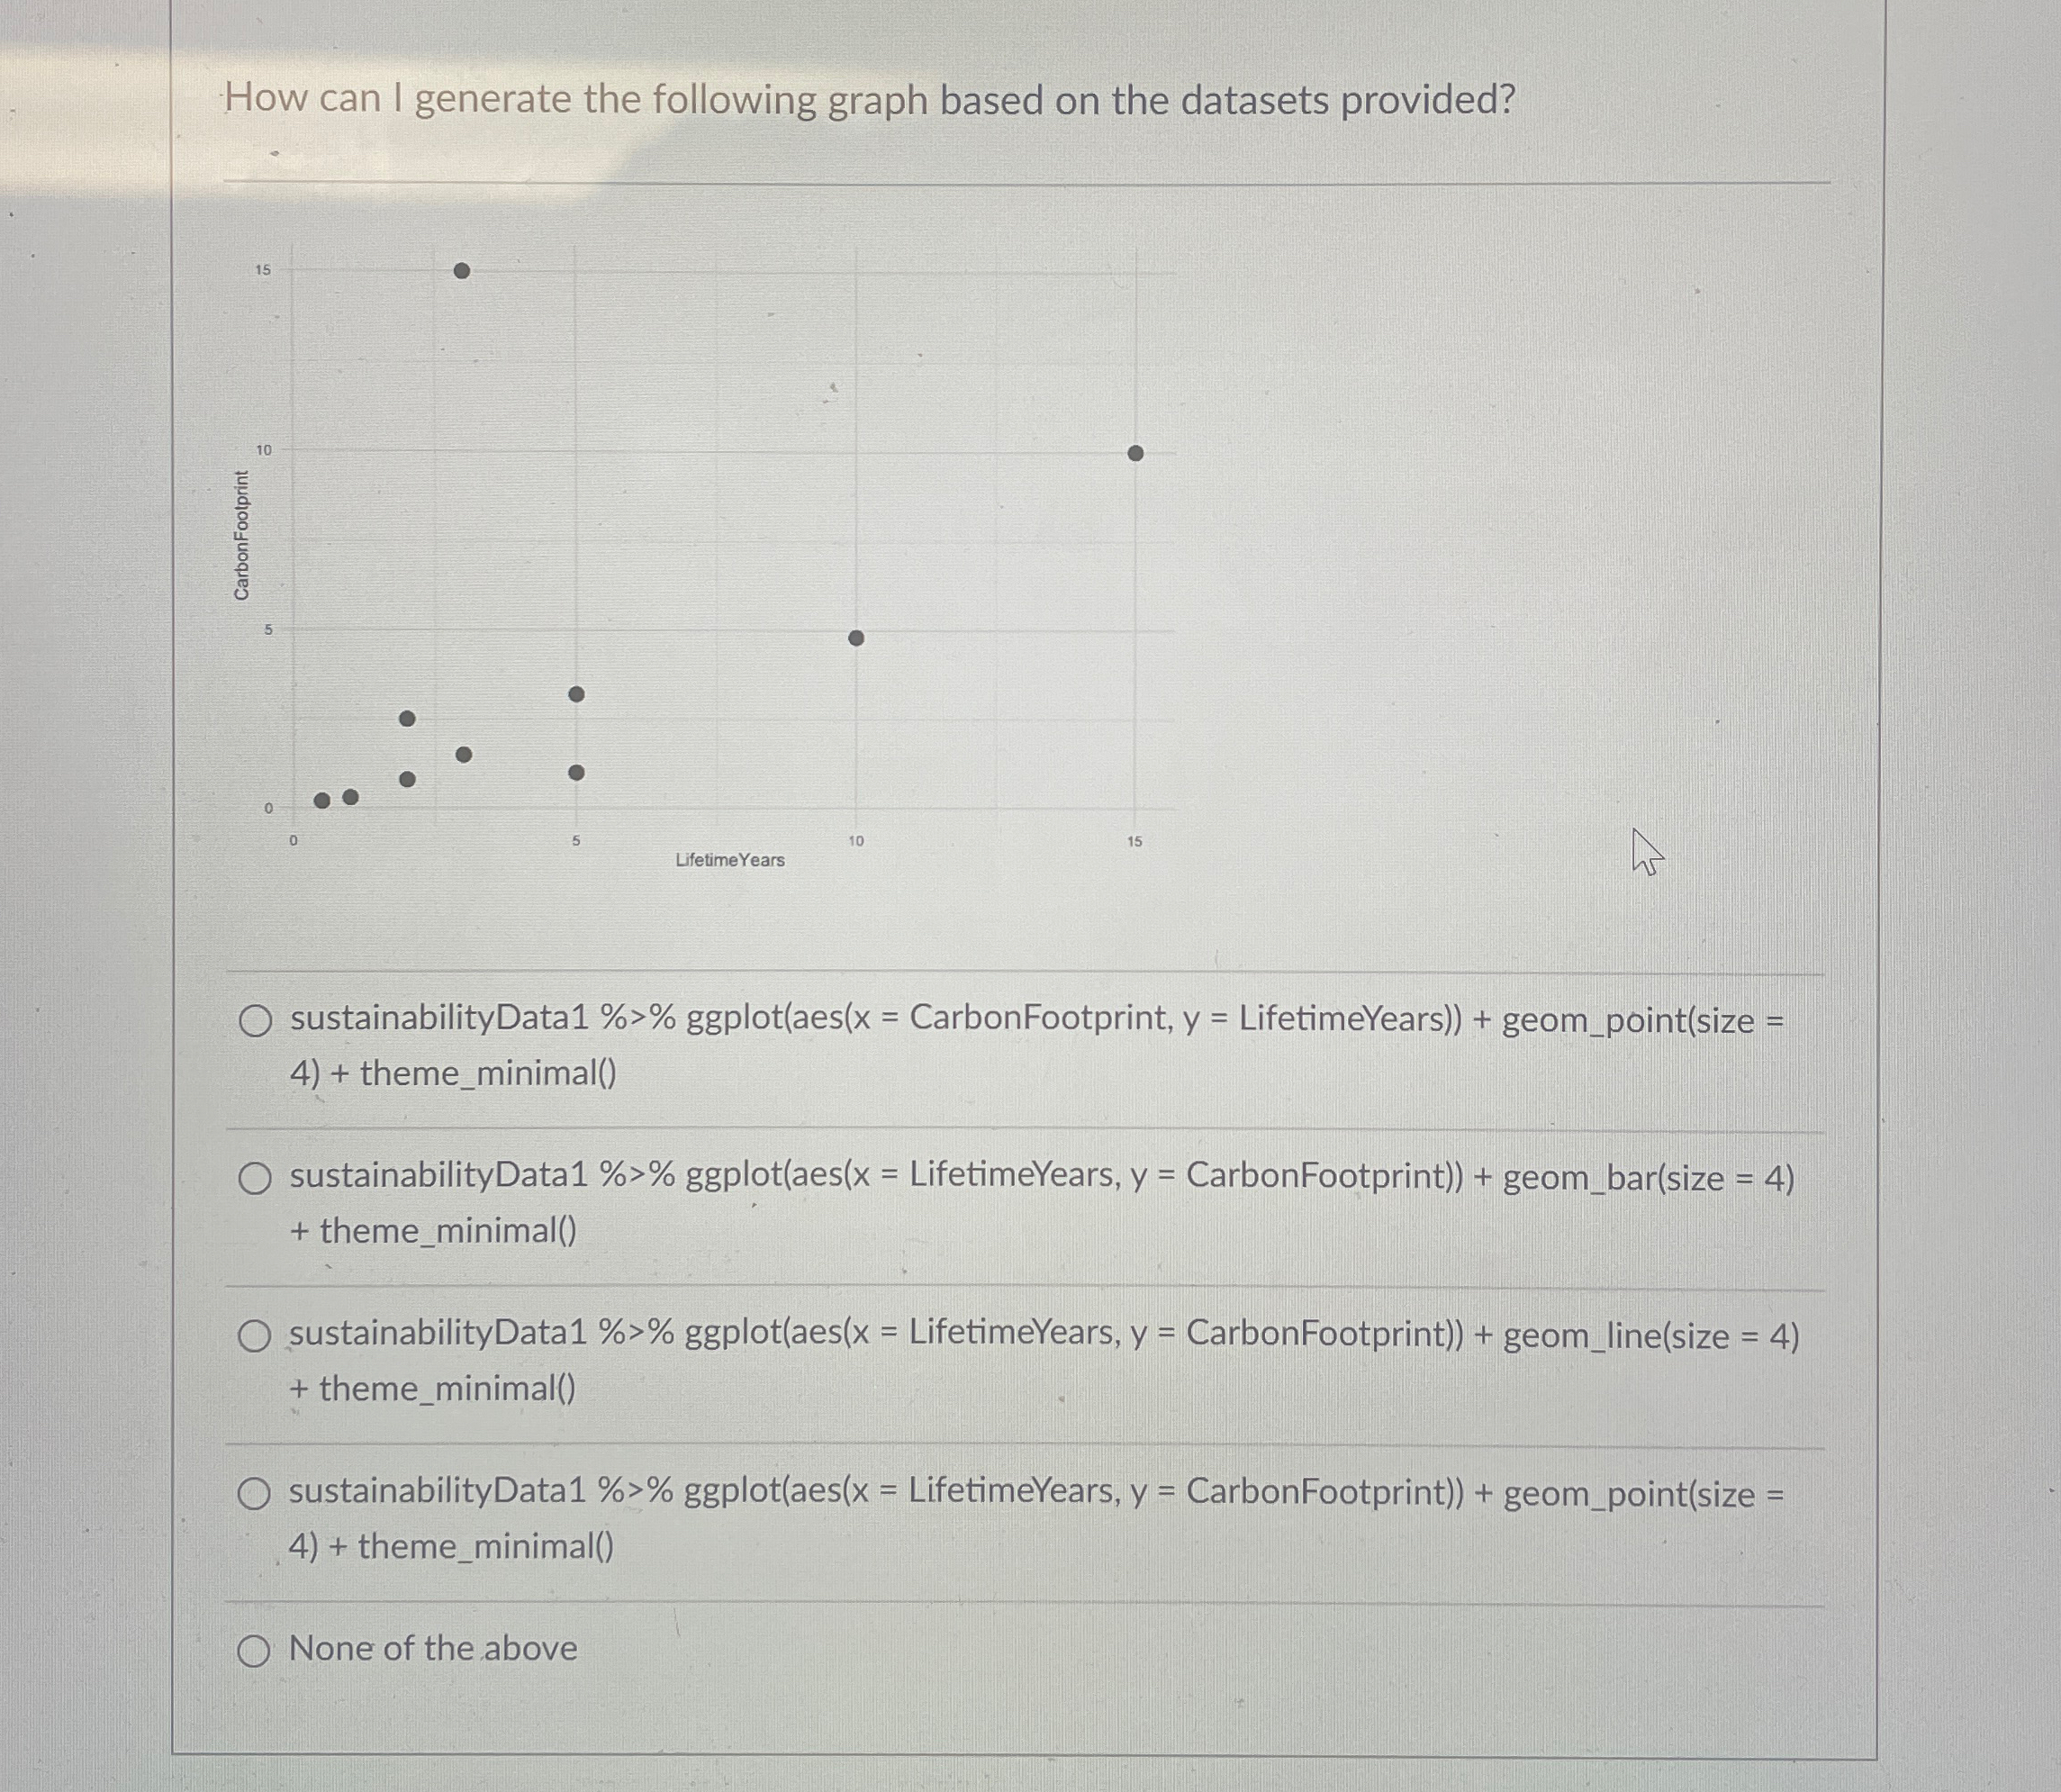
How can I generate the following graph based on the datasets provided?
sustainabilityData ggplotaesx CarbonFootprint, y LifetimeYears geompointsize thememinimal
sustainabilityData ggplotaesx LifetimeYears, y CarbonFootprint geombarsize thememinimal
sustainabilityData ggplotaesx LifetimeYears, CarbonFootprint geomlinesize thememinimal
sustainabilityData ggplotaesx LifetimeYears, y CarbonFootprint geompointsize thememinimal
None of the above
Step by Step Solution
There are 3 Steps involved in it
1 Expert Approved Answer
Step: 1 Unlock

Question Has Been Solved by an Expert!
Get step-by-step solutions from verified subject matter experts
Step: 2 Unlock
Step: 3 Unlock