

Question: How can I graph the both eigenvectors in Matlab. Command Window >> A = [2 1;0 1] A = 2 ON 1 1 >> [V,
How can I graph the both eigenvectors in Matlab.
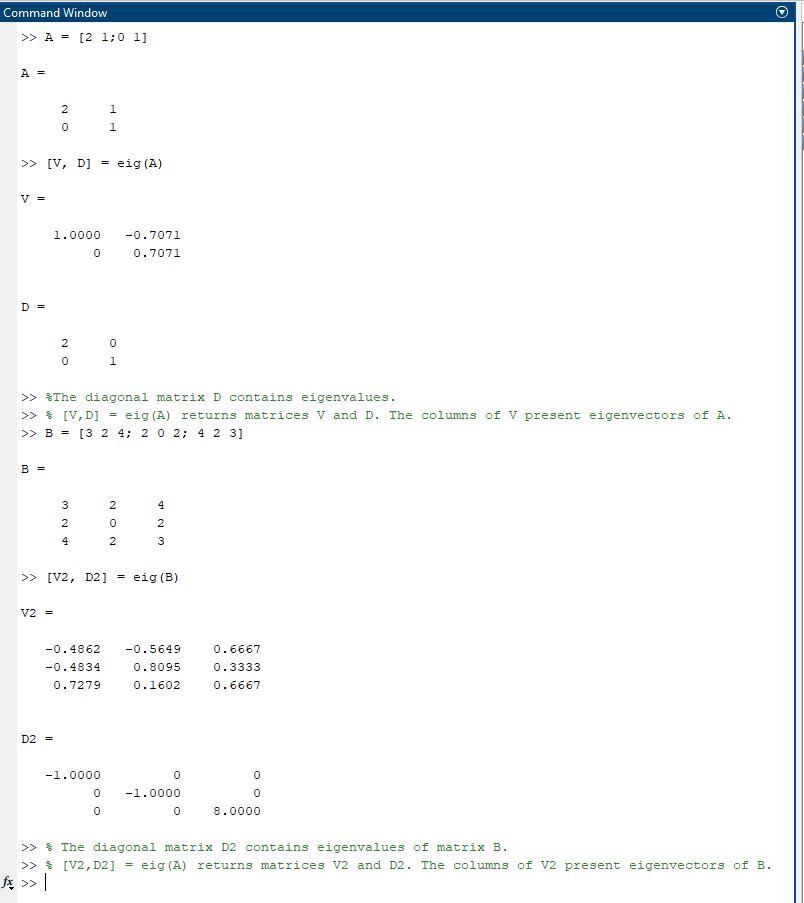
Command Window >> A = [2 1;0 1] A = 2 ON 1 1 >> [V, D] = eig (A) V = -0.7071 1.0000 0 0.7071 D = 2 ON 0 1 >> The diagonal matrix D contains eigenvalues. >> * [V,D] eig (A) returns matrices V and D. The columns of V present eigenvectors of A. >> B = [3 2 4; 2 0 2; 4 2 3] B = 2 4 NW 3 2 4 NON 2 3 2 >> [V2, D2] eig (B) V2 = -0.4862 -0.4834 0.7279 -0.5649 0.8095 0.1602 0.6667 0.3333 0.6667 D2 = 0 -1.0000 0 0 -1.0000 0 0 0 8.0000 >> The diagonal matrix D2 contains eigenvalues of matrix B. >> 3 [V2,D2] = eig(A) returns matrices V2 and D2. The columns of V2 present eigenvectors of B. fx >> |
Step by Step Solution
There are 3 Steps involved in it
1 Expert Approved Answer
Step: 1 Unlock

Question Has Been Solved by an Expert!
Get step-by-step solutions from verified subject matter experts
Step: 2 Unlock
Step: 3 Unlock