

Question: how can i make my tree diagram quantifiable? what do i need? Resulting to Delays Resulting to loss of profit Reprocessing of products Becomes waste/
how can i make my tree diagram quantifiable? what do i need?
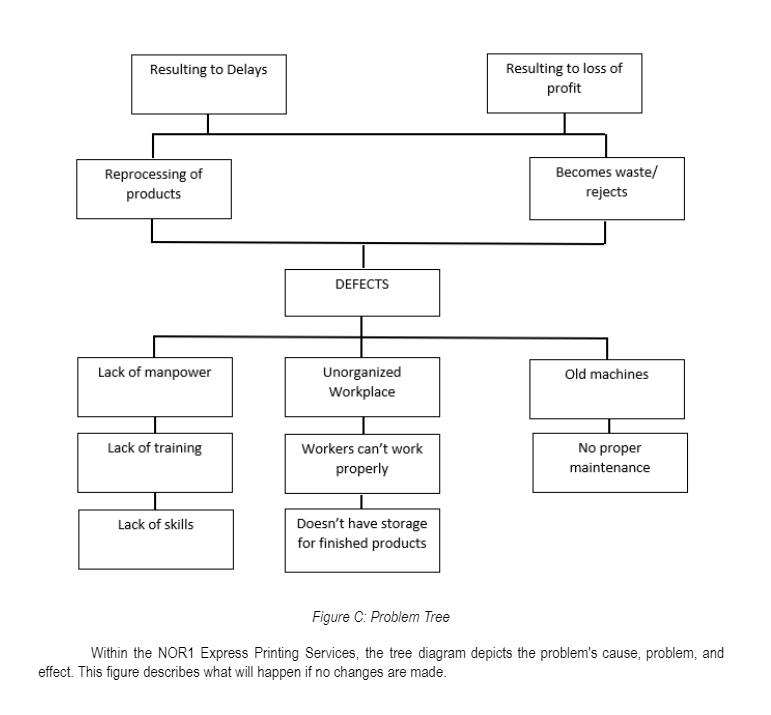
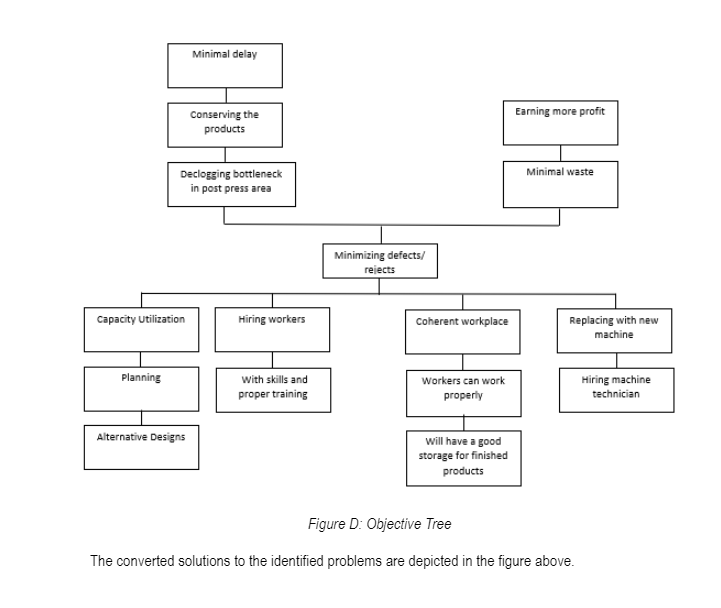
Resulting to Delays Resulting to loss of profit Reprocessing of products Becomes waste/ rejects DEFECTS Lack of manpower Unorganized Workplace Old machines Lack of training Workers can't work properly No proper maintenance Lack of skills Doesn't have storage for finished products Figure C: Problem Tree Within the NOR1 Express Printing Services, the tree diagram depicts the problem's cause, problem, and effect. This figure describes what will happen if no changes are made. Minimal delay Earning more profit Conserving the products Minimal waste Declogging bottleneck in post press area Minimizing defects/ rejects Capacity Utilization Hiring workers Coherent workplace Replacing with new machine Planning with skills and proper training Workers can work property Hiring machine technician Alternative Designs will have a good storage for finished products Figure D: Objective Tree The converted solutions to the identified problems are depicted in the figure aboveStep by Step Solution
There are 3 Steps involved in it
1 Expert Approved Answer
Step: 1 Unlock

Question Has Been Solved by an Expert!
Get step-by-step solutions from verified subject matter experts
Step: 2 Unlock
Step: 3 Unlock