

Question: how can i put a formula to this problem. i have a trouble undesirable how to do the table if marketing exp is, and the
how can i put a formula to this problem. i have a trouble undesirable how to do the table if marketing exp is, and the units sold is. how can i do that in the table?
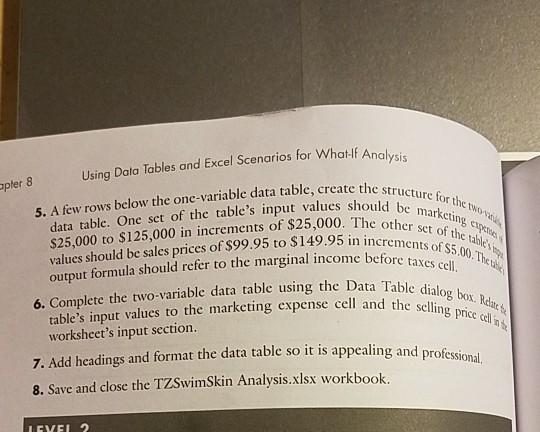
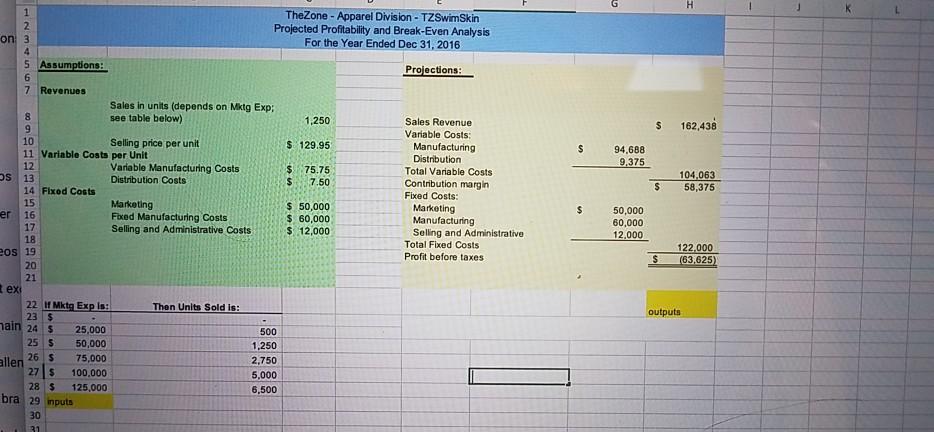
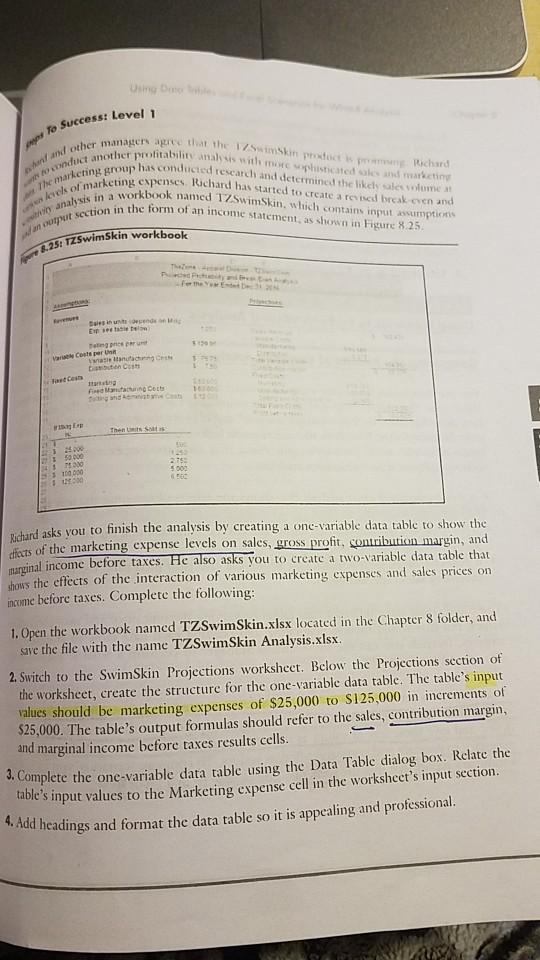
H $ 162,438 $ 94.688 9.375 $ 104,063 58,375 $ 1 TheZone - Apparel Division - TZSwimSkin 2 Projected Profitability and Break-Even Analysis on 3 For the Year Ended Dec 31, 2016 4 5 Assumptions: Projections: 6 7 Revenues Sales in units (depends on Mktg Exp: 8 see table below) 1,250 Sales Revenue 9 Variable Costs 10 Selling price per unit $ 129.95 Manufacturing 11 Variable Costs per Unit Distribution 12 Variable Manufacturing Costs $ 75.75 Total Variable Costs OS 13 Distribution Costs $ 7.50 Contribution margin 14 Fixed Costs Fixed Costs: Marketing $ 50,000 Marketing er 16 Fixed Manufacturing Costs $ 60,000 Manufacturing 17 Selling and Administrative Costs $ 12,000 Selling and Administrative 18 Total Fixed Costs eos 19 Profit before taxes 20 21 ! 22 lf Mktg Exp is: Then Units Sold is: 23$ 25,000 500 25 5 50,000 1,250 26 s allen 75,000 2,750 27S 100.000 5,000 28 $ 125,000 6,500 bra 29 nputs 30 31 50,000 60,000 12.000 $ 122.000 (63,625) outputs ain 24 S To Success: Level 1 Odct another profitability analysis with miehisticated clean marketing and other manager agree that the Skin Richard 7 marketing group has conducted research and determined the likchale volume lack of marketing enpenses Richard has started to create a rand break even and analysis in a workbook named TZSwimSkin, which contains input assumption Apur Section in the form of an income statement, as shown in Figure 8.25 8.2.5: TZSwimSkin workbook Beleid Estate Core watch Nantes tan Fiat Docs 150 000 1 30 10000 100 18 Richard asks you to finish the analysis by creating a one-variable data table to show the effects of the marketing expense levels on sales, gross profit, contribution margin, and surginal income before taxes. He also asks you to create a two-variable data table that shows the effects of the interaction of various marketing expenses and sales prices on income before taxes. Complete the following: 1. Open the workbook named TZSwimSkin.xlsx located in the Chapter 8 folder, and save the file with the name TZSwimSkin Analysis.xlsx 2. Switch to the SwimSkin Projections worksheet. Below the Projections section of the worksheet, create the structure for the one-variable data table. The table's input values should be marketing expenses of $25,000 to $125,000 in increments of $25,000. The table's output formulas should refer to the sales, contribution margin, and marginal income before taxes results cells. 2. Complete the one-variable data table using the Data Table dialog box. Relate the table's input values to the Marketing expense cell in the worksheet's input section. 4. Add headings and format the data table so it is appealing and professional. Using Data Tables and Excel Scenarios for What If Analysis apter 8 5. A few rows below the one-variable data table, create the structure for the WW data table. One sct of the table's input values should be marketing expert values should be sales prices of $99.95 to $149.95 in increments of $5.00. The $25,000 to $125,000 in increments of $25,000. The other set of the wake output formula should refer to the marginal income before taxes cell. 6. Complete the two variable data table using the Data Table dialog box.de table's input values to the marketing expense cell and the selling price worksheet's input section. 7. Add headings and format the data table so it is appealing and professional, 8. Save and close the TZSwimSkin Analysis.xlsx workbook. LEVEL 2 H $ 162,438 $ 94.688 9.375 $ 104,063 58,375 $ 1 TheZone - Apparel Division - TZSwimSkin 2 Projected Profitability and Break-Even Analysis on 3 For the Year Ended Dec 31, 2016 4 5 Assumptions: Projections: 6 7 Revenues Sales in units (depends on Mktg Exp: 8 see table below) 1,250 Sales Revenue 9 Variable Costs 10 Selling price per unit $ 129.95 Manufacturing 11 Variable Costs per Unit Distribution 12 Variable Manufacturing Costs $ 75.75 Total Variable Costs OS 13 Distribution Costs $ 7.50 Contribution margin 14 Fixed Costs Fixed Costs: Marketing $ 50,000 Marketing er 16 Fixed Manufacturing Costs $ 60,000 Manufacturing 17 Selling and Administrative Costs $ 12,000 Selling and Administrative 18 Total Fixed Costs eos 19 Profit before taxes 20 21 ! 22 lf Mktg Exp is: Then Units Sold is: 23$ 25,000 500 25 5 50,000 1,250 26 s allen 75,000 2,750 27S 100.000 5,000 28 $ 125,000 6,500 bra 29 nputs 30 31 50,000 60,000 12.000 $ 122.000 (63,625) outputs ain 24 S To Success: Level 1 Odct another profitability analysis with miehisticated clean marketing and other manager agree that the Skin Richard 7 marketing group has conducted research and determined the likchale volume lack of marketing enpenses Richard has started to create a rand break even and analysis in a workbook named TZSwimSkin, which contains input assumption Apur Section in the form of an income statement, as shown in Figure 8.25 8.2.5: TZSwimSkin workbook Beleid Estate Core watch Nantes tan Fiat Docs 150 000 1 30 10000 100 18 Richard asks you to finish the analysis by creating a one-variable data table to show the effects of the marketing expense levels on sales, gross profit, contribution margin, and surginal income before taxes. He also asks you to create a two-variable data table that shows the effects of the interaction of various marketing expenses and sales prices on income before taxes. Complete the following: 1. Open the workbook named TZSwimSkin.xlsx located in the Chapter 8 folder, and save the file with the name TZSwimSkin Analysis.xlsx 2. Switch to the SwimSkin Projections worksheet. Below the Projections section of the worksheet, create the structure for the one-variable data table. The table's input values should be marketing expenses of $25,000 to $125,000 in increments of $25,000. The table's output formulas should refer to the sales, contribution margin, and marginal income before taxes results cells. 2. Complete the one-variable data table using the Data Table dialog box. Relate the table's input values to the Marketing expense cell in the worksheet's input section. 4. Add headings and format the data table so it is appealing and professional. Using Data Tables and Excel Scenarios for What If Analysis apter 8 5. A few rows below the one-variable data table, create the structure for the WW data table. One sct of the table's input values should be marketing expert values should be sales prices of $99.95 to $149.95 in increments of $5.00. The $25,000 to $125,000 in increments of $25,000. The other set of the wake output formula should refer to the marginal income before taxes cell. 6. Complete the two variable data table using the Data Table dialog box.de table's input values to the marketing expense cell and the selling price worksheet's input section. 7. Add headings and format the data table so it is appealing and professional, 8. Save and close the TZSwimSkin Analysis.xlsx workbook. LEVEL 2
Step by Step Solution
There are 3 Steps involved in it

Get step-by-step solutions from verified subject matter experts