

Question: `how can i solve this problem can some break it down for me A random sample of 16 undergraduate students receiving student loans was obtained,
`how can i solve this problem can some break it down for me
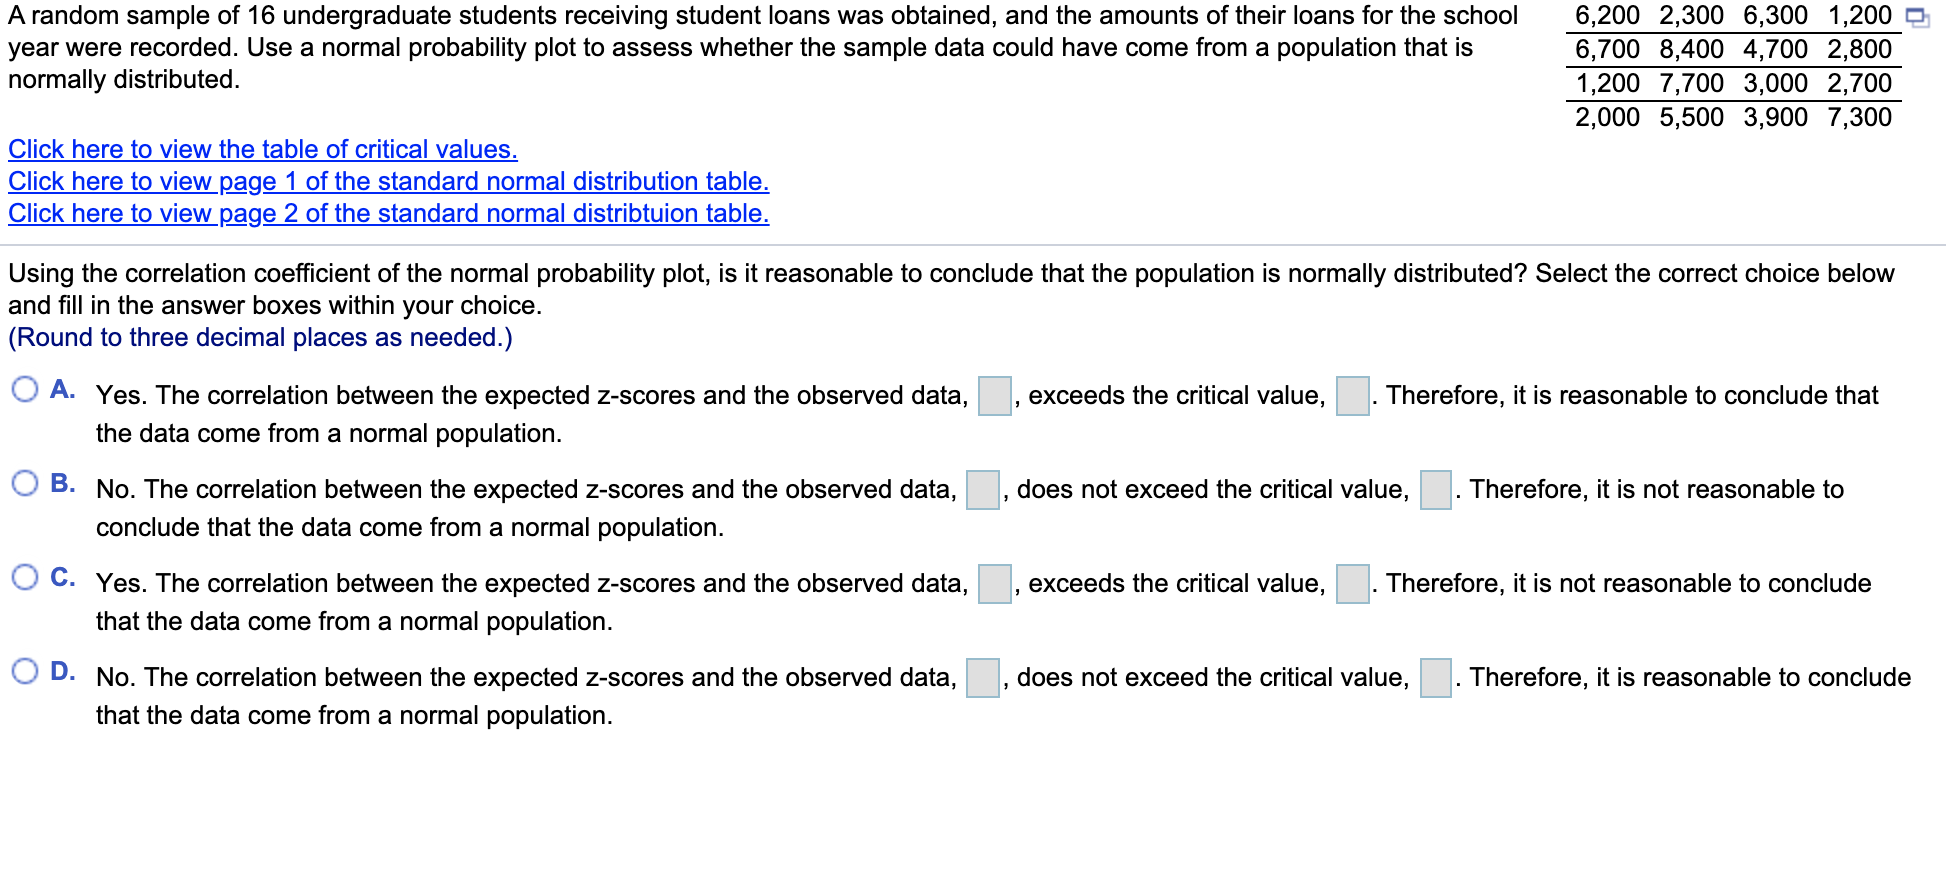
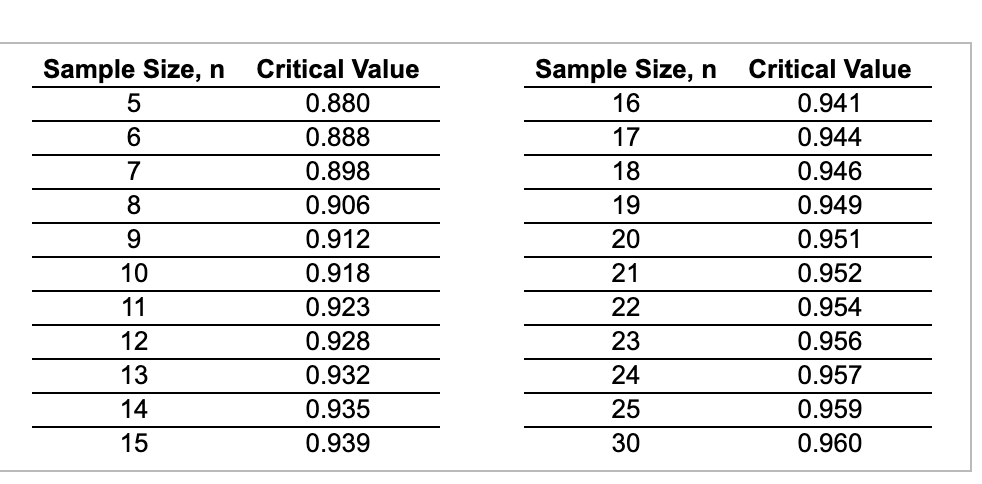
A random sample of 16 undergraduate students receiving student loans was obtained, and the amounts of their loans for the school 6,200 2,300 6,300 1,200 D. year were recorded. Use a normal probability plot to assess whether the sample data could have come from a population that is 6,700 8,400 4,700 2,800 normally distributed. 1,200 7,700 3,000 2,700 2,000 5,500 3,900 7,300 Click here to view the table of critical values. Click here to view page 1 of the standard normal distribution table. Click here to view page 2 of the standard normal distribtuion table. Using the correlation coefcient of the normal probability plot, is it reasonable to conclude that the population is normally distributed? Select the correct choice below and ll in the answer boxes within your choice. (Round to three decimal places as needed.) 0 A- Yes. The correlation between the expected z-scores and the observed data, D, exceeds the critical value, El. Therefore, it is reasonable to conclude that the data come from a normal population. 0 3- No. The correlation between the expected zscores and the observed data, B, does not exceed the critical value, D. Therefore, it is not reasonable to conclude that the data come from a normal population. 0 c- Yes. The correlation between the expected z-scores and the observed data, D, exceeds the critical value, El. Therefore, it is not reasonable to conclude that the data come from a normal population. 0 D- No. The correlation between the expected z-scores and the observed data, B does not exceed the critical value, D. Therefore, it is reasonable to conclude that the data come from a normal population. \f
Step by Step Solution
There are 3 Steps involved in it

Get step-by-step solutions from verified subject matter experts