

Question: how can i solve this question please 1) Consider the following data set. 2 3 4 5 6 y 3.00 0.21 0.61 0.70 1.13 1.17
how can i solve this question please
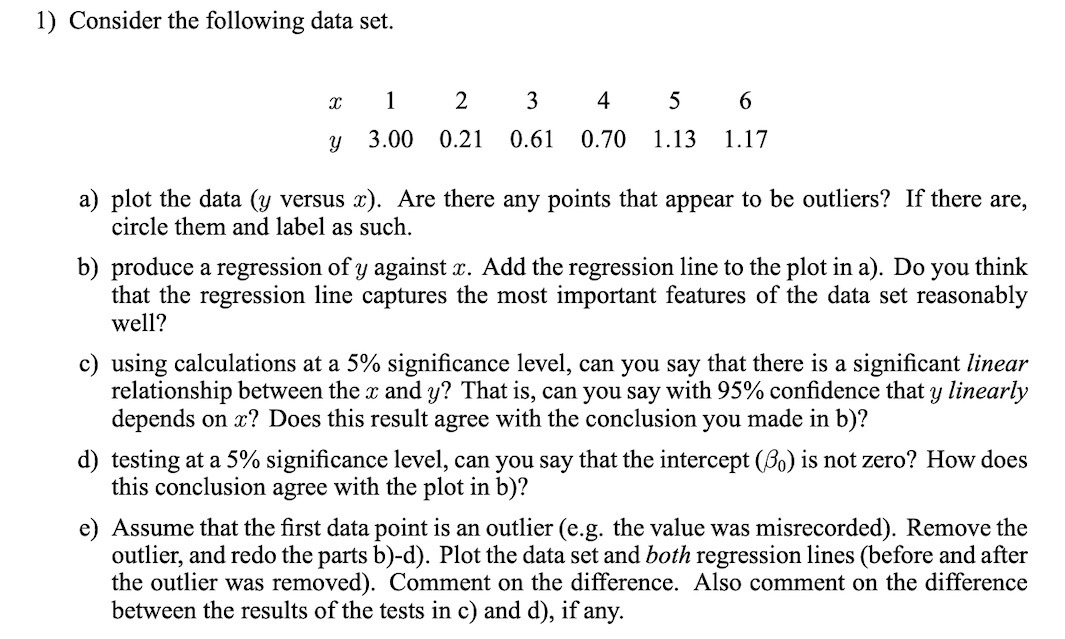
1) Consider the following data set. 2 3 4 5 6 y 3.00 0.21 0.61 0.70 1.13 1.17 a) plot the data (y versus x). Are there any points that appear to be outliers? If there are, circle them and label as such. b) produce a regression of y against x. Add the regression line to the plot in a). Do you think that the regression line captures the most important features of the data set reasonably well? c) using calculations at a 5% significance level, can you say that there is a significant linear relationship between the x and y? That is, can you say with 95% confidence that y linearly depends on x? Does this result agree with the conclusion you made in b)? d) testing at a 5% significance level, can you say that the intercept (30) is not zero? How does this conclusion agree with the plot in b)? e) Assume that the first data point is an outlier (e.g. the value was misrecorded). Remove the outlier, and redo the parts b)-d). Plot the data set and both regression lines (before and after the outlier was removed). Comment on the difference. Also comment on the difference between the results of the tests in c) and d), if any
Step by Step Solution
There are 3 Steps involved in it

Get step-by-step solutions from verified subject matter experts