Question: How can we do better for next time in our decision making processes? Annual Report Annual Report Andrews C132118 Round: 8 Dec. 31, 2029 Balance
How can we do better for next time in our decision making processes?
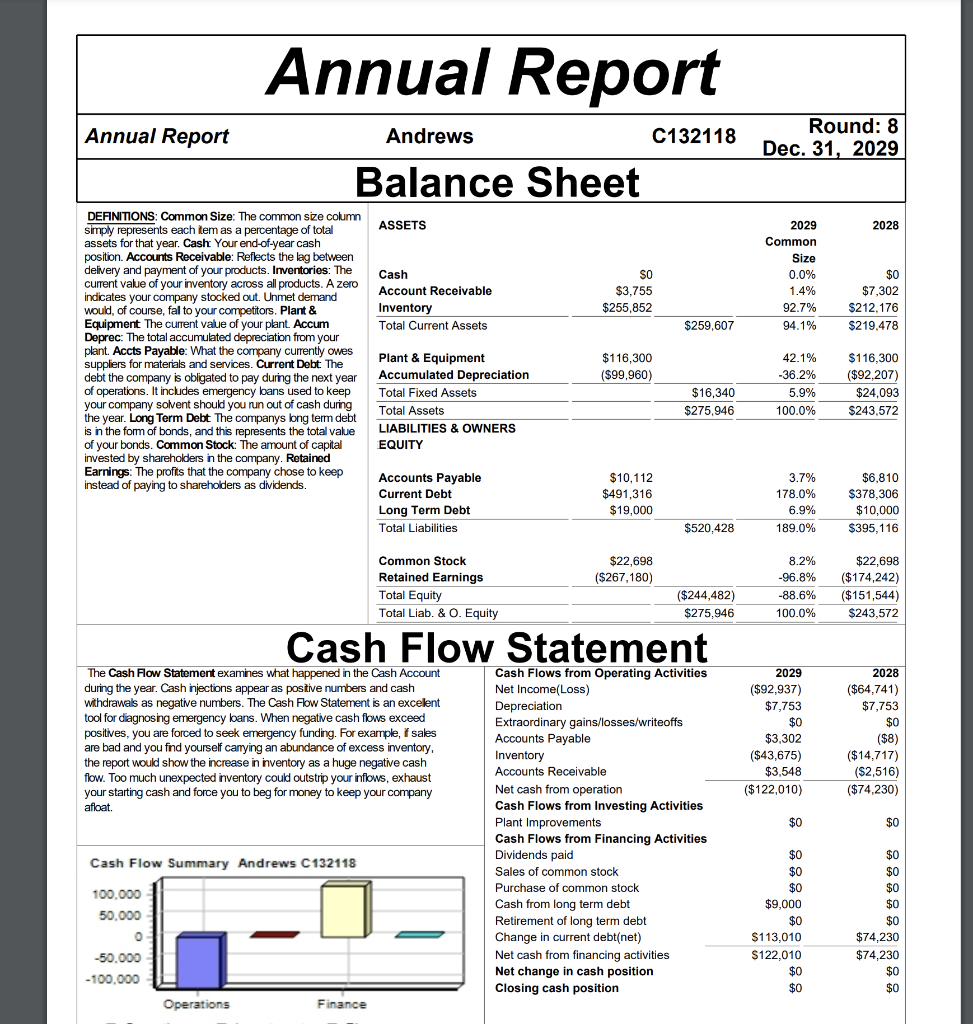
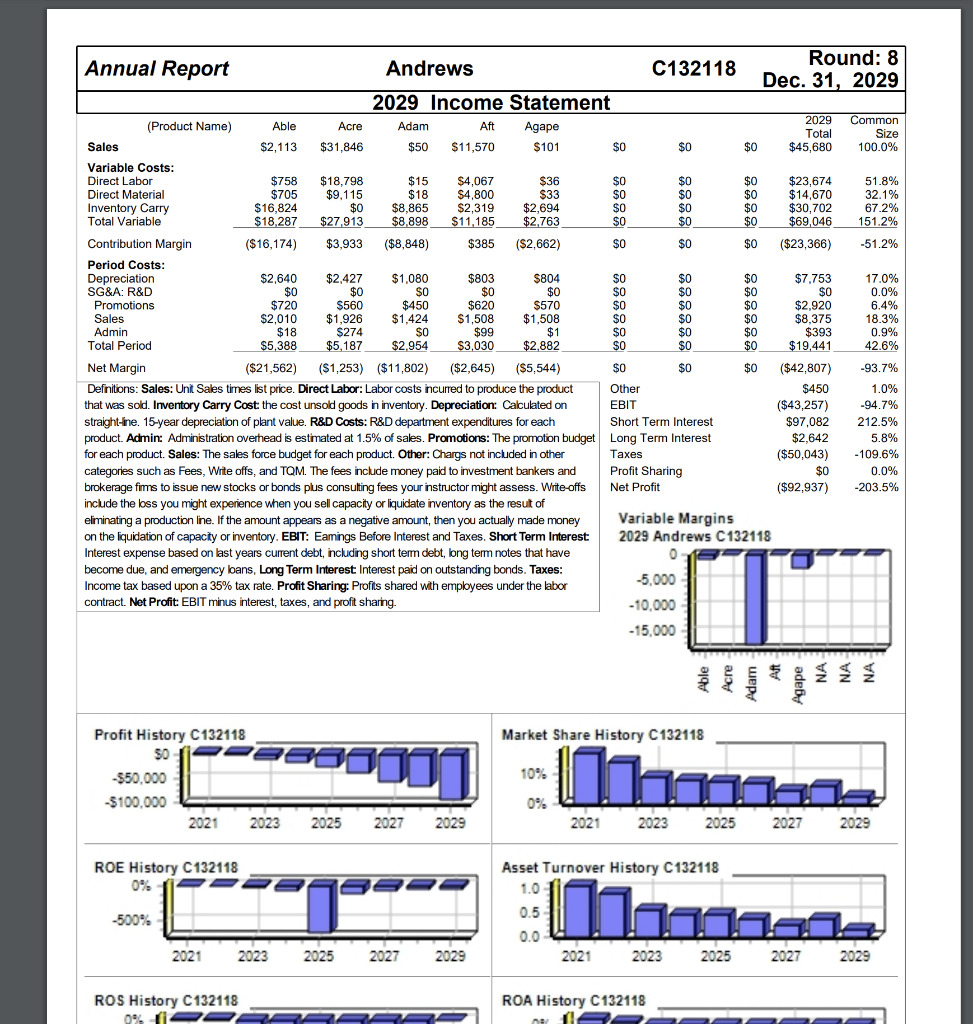
Annual Report Annual Report Andrews C132118 Round: 8 Dec. 31, 2029 Balance Sheet ASSETS 2028 Cash Account Receivable Inventory Total Current Assets SO $3.755 $255,852 2029 Common Size 0.0% 1.4% 92.7% 94.1% $0 $7,302 $212.176 $219.478 $259,607 DEANITIONS. Common Size: The common size column simply represents each tem as a percentage of total assets for that year. Cash: Your end-of-year cash position. Accounts Receivable: Reflects the lag between delivery and payment of your products. Inventories: The current value of your inventory across all products. A zero indicates your company stocked out. Unmet demand would, of course, fal to your competitors. Plant & Equipment The current value of your plant. Accum Deprec: The total accumulated depreciation from your plant. Accts Payable: What the company currently owes suppliers for materials and services. Current Debt The debt the company is obligated to pay during the next year of operations. It includes emergency loans used to keep your company solvent should you run out of cash during the year. Long Term Debt The companys long term debt is in the form of bonds, and this represents the total value of your bonds. Common Stock: The amount of capital invested by shareholders in the company. Retained Earnings: The profits that the company chose to keep instead of paying to shareholders as dividends. $116,300 ($99,960) Plant & Equipment Accumulated Depreciation Total Fixed Assets Total Assets LIABILITIES & OWNERS EQUITY 42.1% -36.2% 5.9% 100.0% $116,300 ($92,207) $24,093 $243,572 $16,340 $275,946 Accounts Payable Current Debt Long Term Debt Total Liabilities $10,112 $491,316 $19,000 3.7% 178.0% 6.9% 189.0% $6,810 $378,306 $10.000 $395,116 $520,428 $22,698 ($267,180) Common Stock Retained Earnings Total Equity Total Liab. & O. Equity ($244,482) $275,946 8.2% -96.8% -88.6% 100.0% $22,698 ($174,242) ($151,544) $243,572 Cash Flow Statement The Cash Flow Statement examines what happened in the Cash Account during the year. Cash injections appear as positive numbers and cash withdrawals as negative numbers. The Cash Flow Statement is an excelent tool for diagnosing emergency lans. When negative cash flows exceed positives, you are forced to seek emergency funding. For example, f sales are bad and you find yourself canying abundance of excess inventory, the report would show the increase in inventory as a huge negative cash flow. Too much unexpected inventory could outstrip your inflows, exhaust your starting cash and force you to beg for money to keep your company afloat 2029 ($92,937) $7,753 $0 $3,302 ($43,675) $3,548 ($122,010) 2028 ($64,741) $7,753 $0 ($8) ($14,717) ($2,516) ($74,230) $0 $0 Cash Flows from Operating Activities Net Income(Loss) Depreciation Extraordinary gains/losses/writeoffs Accounts Payable Inventory Accounts Receivable Net cash from operation Cash Flows from Investing Activities Plant Improvements Cash Flows from Financing Activities Dividends paid Sales of common stock Purchase of common stock Cash from long term debt Retirement of long term debt Change in current debt(net) Net cash from financing activities Net change in cash position Closing cash position Cash Flow Summary Andrews C132118 100.000 50.000 0 -50.000 - 100.000 $0 $0 $0 $9,000 $0 $113,010 $122,010 $0 $0 $0 $0 $0 $0 $0 $0 $74,230 $74,230 $0 $0 Operations Finance $560 $450 $620 Annual Report Andrews Round: 8 C132118 Dec. 31, 2029 2029 Income Statement 2029 (Product Name) Able Acre Adam Aft Agape Common Total Size Sales $2,113 $31,846 $50 $11,570 $101 $0 $0 $0 $45,680 100.0% Variable Costs: Direct Labor $758 $18,798 $15 $4,067 $36 $0 $0 $0 $23,674 51.8% Direct Material $705 $9,115 $18 $4,800 $33 SO $0 $0 $14,670 32.1% Inventory Carry $16,824 $0 $8,865 $2,319 $2,694 $0 $0 $0 $30,702 67.2% Total Variable $18,287 $27,913 $8,898 $11,185 $2,763 $0 $0 $0 $69,046 151.2% Contribution Margin ($16,174) $3,933 ($8,848) $385 ($2,662) $0 $0 $0 ($23,366) -51.2% Period Costs: Depreciation $2,640 $2,427 $1,080 $803 $804 SO $0 $0 $7.753 17.0% SG&A: R&D $0 $0 SO $0 $0 SO $0 $0 $0 0.0% Promotions $720 $570 $0 $0 $0 $2.920 6.4% Sales $2,010 $1,926 $1,424 $1,508 $1,508 $0 $0 $0 $8.375 18.3% Admin $18 $274 $0 $99 $1 SO $0 $0 $393 0.9% Total Period $5,388 $5,187 $2.954 $3,030 $2.882 $0 $0 $0 $19,441 42.6% Net Margin ($21,562) ($1,253) ($11,802) ($2,645) ($5,544) $0 $0 $0 ($42,807) -93.7% Defnitions: Sales: Unit Sales times list price. Direct Labor: Labor costs incurred to produce the product Other $450 1.0% that was sold. Inventory Carry Cost the cost unsold goods in inventory. Depreciation: Calculated on EBIT ($43,257) -94.7% straight-ine. 15-year depreciation of plant value. R&D Costs: R&D department expenditures for each Short Term Interest $97.082 212.5% product . Admin: Administration overhead is estimated at 1.5% of sales. Promotions: The promotion budget Long Term Interest $2,642 5.8% for each product. Sales: The sales force budget for each product. Other: Chargs not included in other Taxes ($50,043) -109.6% categories such as Fees, Write offs, and TQM. The fees include money paid to investment bankers and Profit Sharing $0 0.0% brokerage fims to issue new stocks or bonds plus consulting fees your instructor might assess. Write-offs Net Profit ($92,937) -203.5% include the loss you might experience when you sel capacity or liquidate inventory as the result of eliminating a production line. If the amount appears as a negative amount, then you actually made money Variable Margins on the liquidation of capacity or inventory. EBIT: Eamings Before Interest and Taxes. Short Term Interest 2029 Andrews C132118 Interest expense based on last years current debt, including short term debt, long term notes that have 0 become due, and emergency loans, Long Term Interest Interest paid on outstanding bonds. Taxes: Income tax based upon a 35% tax rate. Profit Sharing: Profits shared with employees under the labor -5.000 contract. Net Profit: EBIT minus interest, taxes, and profit sharing. -10,000 - 15,000 Market Share History C132118 Profit History C132118 SO -$50,000 $100,000 2021 2023 1011 10% Uinnials 2025 2027 2029 2021 2023 2025 2027 2029 ROE History C132118 0% Asset Turnover History C132118 1.0 0.5 0.0 2021 2023 (1970an -500% 2021 2023 2025 2027 2029 2025 2027 2029 ROS History C132118 0% fi ROA History C132118 112


