

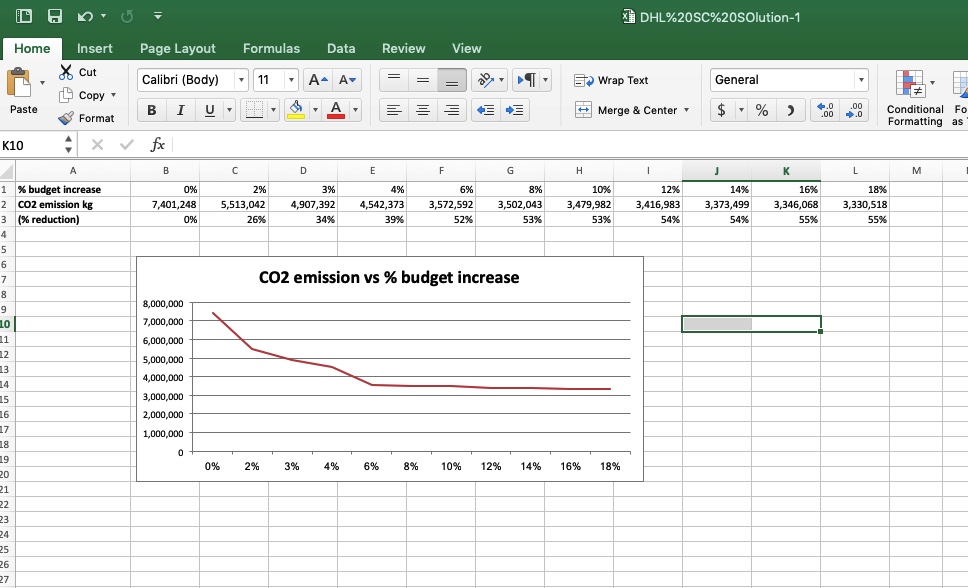
Question: How do budget changes affect the carbon dioxide (CO2) emission in the transportation of LCD TVs from their manufacturing bases to a distribution center (DC).
How do budget changes affect the carbon dioxide (CO2) emission in the transportation of LCD TVs from their manufacturing bases to a distribution center (DC).
What is the optimal budget increase?
?
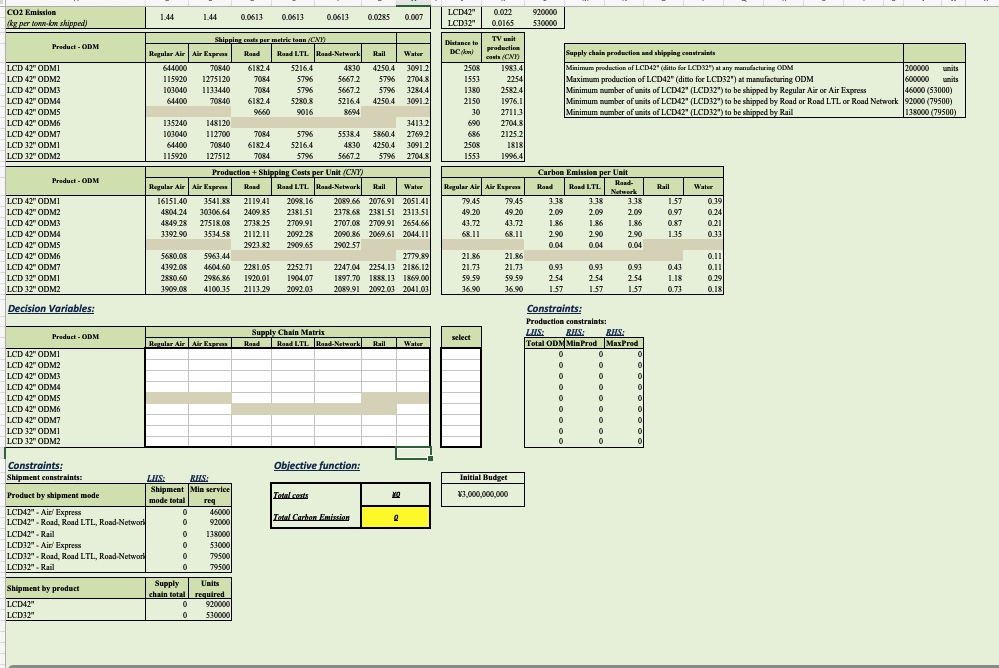
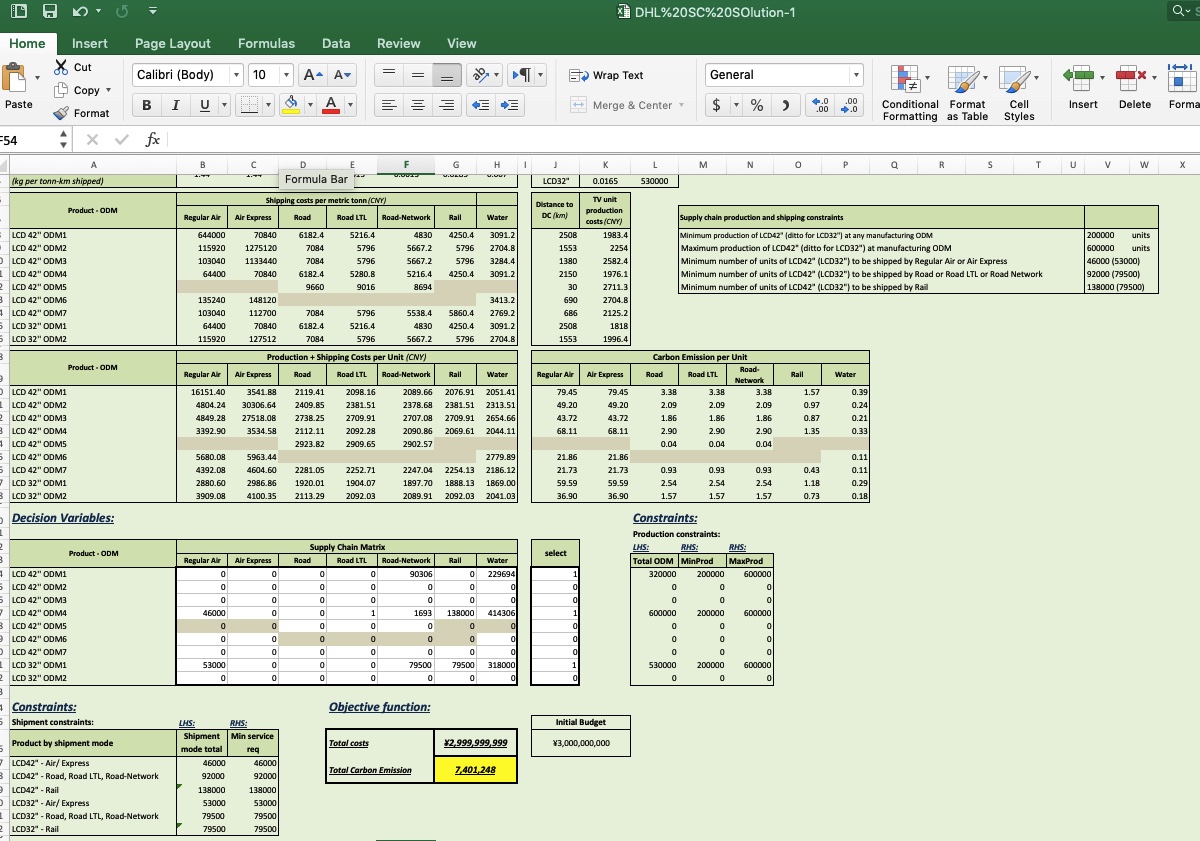
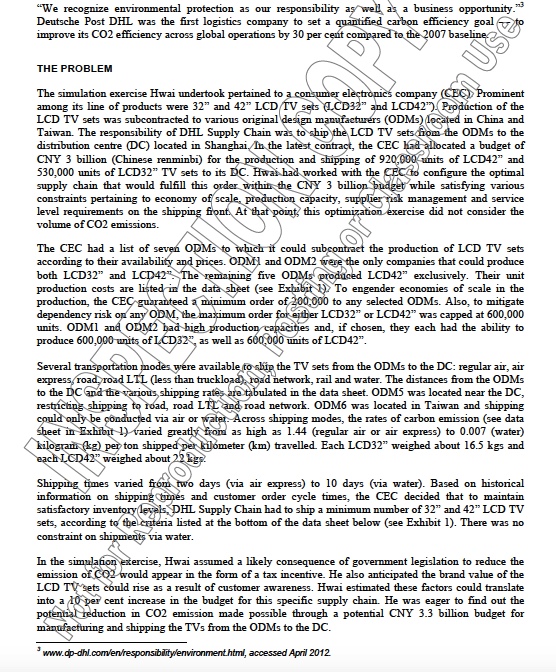
CO2 Emission 1.44 1.44 0.0613 0 0613 (0513 00185 LCD42" 0.072 920000 LCD32" 0.0165 530000 Product - ODM Shipping costs per metric tann (CN Distance to TV unit Regular Air | Air Express Rand Rand LTL. Hand-Network Water production cash CNT) upply chain production and shipping constraints LCD 42" ODMI $44000 70840 6182 4 52164 4830 4350.4 3091.2 2508 1983.4 Minimum production of LCD42" (ditio for LCDS.") at any manufacturing ODM 200000 LCD 42" ODM 115920 1275120 5796 1667 1 579 2704 8 1553 2354 Maximum production of LCD42" (ditto for LCD32") at manufacturing ODM $00000 units LCD 42" ODM3 103040 1133440 5796 5667 5796 3284.4 1380 2582 4 Minimum number of units of LCD42" (LCD32") to be shipped by Regular Air or Air Express 46000 (53000) LCD 42" ODM4 64400 $182 4 $280 8 52164 42504 3091.2 2150 1976.1 LCD 42" ODM5 Minimum number of units of LCD42" (LCD32") to be shipped by Road or Road LTL or Road Network 92000 (79500) 9660 9016 8594 27113 LCD 42" ODM6 Minimum number of units of LCD42" (LCD32") to be shipped by Rail 138000 (79500) 135240 148120 3413.2 690 2704 8 LCD 42" ODM7 103040 112700 5796 5538.4 5860.4 2769 2 686 2125.2 LCD 32" ODMI 64400 70840 6182 4 52164 4830 42504 3091.2 2508 1818 LCD 32" ODM2 15920 127512 5796 5796 2704 8 1553 1996.4 Product - ODM Production + Shipping Costs per Unit (CMY Carbon Emission per Unit Regular Air Air Expres Rand Hand LTL. Hand-Network Wats Regular Air| Air Express Rand Rand LTL. Rand mail Water LCD 42" ODM 16151.40 3541 88 21 19.41 2098.16 2089 66 2076.91 2051.41 79.45 79.45 3.38 157 0 39 LCD 42" ODM2 4804 24 70305.64 2409 85 2181.51 2178 68 2381.51 2 2313.51 49 20 49.20 109 209 209 0.97 0.24 LCD 42" ODM3 4849 28 27518 08 2738 25 2709.91 2707 08 2709 91 2654.66 43.72 43.72 1.86 1 86 1 86 0.ST 0.21 LCD 42" ODM4 1392 90 3534 58 21 12 11 2092 18 2090 86 2069 61 2044.11 58.11 68.11 790 2 90 1.35 LCD 42" ODM5 1909 65 2902 57 0.04 0.04 0.04 LCD 42" ODM6 5680 08 5963.44 21 86 21.86 0.11 LCD 42" ODM7 4392 08 4604 60 2181 05 3152 71 214704 2154_13 2186.12 21.7 21.7 0.93 0.93 0.91 0.43 LCD 32" ODMI 2890.60 1986.86 1920.01 1904 0 1897 70 1888.13 186900 1909.08 59 59 59 5 2 54 2 54 254 1.18 0.291 LCD 32" ODM2 4100 35 2113.29 2092 03 2089 91 2092 03 2041.02 36.90 36.90 1.57 0.73 0.18 Decision Variables: Constraints: Production constraints: Product - ODM Supply Chain Matrix LMS. Regular Air | Air Engreas d Rand LTL. Hand-Network Rail Water select Total ODM MinProd MaxProd LCD 42" ODMI LCD 42" ODMZ LCD 42" ODM3 LCD 42" ODM4 LCD 42" ODM LCD 42" ODM6 LCD 42" ODM7 LCD 32" ODM LCD 32" ODM2 Constraints: Objective function: Shipment constraints: LIS. Initial Budget Product by shipment mode Shipment Min service mode total req Total can's 110 13,000,000,000 LCD41" - Air/ Express 0 46000 LCD42" - Road, Road LTL, Road-Network Total Carbon Emission LCD42" - Rail 138000 LCD32" - Air/ Express 300 LCD32" - Road, Road LTL, Road-Network 79500 LCD12" - Rail 19500 Shipment by product Supply Units chain total | required LCD42" 920900 LCD32" $300001 DHL%20SC%20SOlution-1 Home Insert Page Layout Formulas Data Review Calibri (Body) * 10 . A- A Wrap Text General Paste Format BI UTY. A. Merge & Center .0 Conditional Format Cell Formatting as Table 54 X G M N 0 P Q R T U V W (kg per tonn-km shipped) Formula Bar LCD32" TV unit Product . ODM shipping costs per metric tonn (CNY) Road Road LTL Road-Network Water DC (lom) production costs (CNY] upply chain production and shipping constraints 6182.4 4250.4 1983.4 units LCD 42" ODM2 15920 1275120 7084 5796 5667. 5796 155 2254 Maximum production of LCD42" (ditto for LCD32") at manufacturing ODM units LCD 42" ODM3 103040 1133440 7084 5796 5667.2 5796 3284.4 1380 2582.4 Minimum number of units of LCD42" (LCD32") to be shipped by Regular Air or Air Express 46000 (53000) LCD 42" ODM4 70840 280. 5216.4 2150 1976.1 Minimum number of units of LCD42" (LCD32") to be shipped by Road or Road LTL or Road Network 92000 (79500) LCD 42" ODM5 9660 8694 30 Minimum number of units of LCD42" (LCD32") to be shipped by Rail 138000 (79500) LCD 42" ODMG 135240 14812 690 LCD 42" ODM7 103040 112700 7084 5796 5538.4 5860.4 686 2125.2 LCD 32" ODM 6440 70340 216.4 4830 2508 1818 LCD 32" ODM2 115920 127512 7084 5796 5667.2 5796 1553 1996.4 Product . ODM Production + Shipping Costs per Unit (CNY) Carbon Emission per Unit Regular Air Road Road LTL Rall Road Road LTL Road. Network Rail Water 16151.40 3541.83 2119.41 2089.66 2076.91 2051.41 79.45 79.4 3.3 3.38 1.5 0.39 4804.24 30306.64 2409.8 2381.51 2378.68 49.20 49.20 2.0 2.0 0.97 0.24 4849.23 2707.08 2709.91 2654.65 43.72 43.72 1.86 1.86 1.86 0.8 0.21 LCD 42" ODM4 3392.90 2092.28 2090.86 2069.61 2044.11 68.11 58.11 2.90 2.9 2.90 1.35 0.33 LCD 42" ODM5 2923.82 2909.65 2902.57 0.0 0.04 LCD 42" ODMG 5680.08 5963.44 21.86 21.86 0.11 LCD 42" ODM7 4392.08 4604.60 2281.05 2252.71 2247.04 2254.13 2186.12 21.73 21.73 1.93 0.93 0.93 0.43 0.11 LCD 32" ODM1 2830.60 986.86 1920.0 1904.07 1897.70 1838.13 1869.00 59.59 59.59 2.54 2.54 2.54 1.18 0.29 LCD 32" ODM2 2089.91 2092.03 2041.03 36.90 36.90 0.73 Decision Variables: Production constraints: Product . ODM Supply Chain Matrix select RHS: RHS: Total ODM |MinProd MaxProd LCD 42" ODM1 10306 320000 LCD 42" ODM2 200000 LCD 42" ODM3 LCD 42" ODM4 6000 1693 138000 5000 00 200000 bLODO0 o ol 0 0 0 o 53000 79500 79500 318000 300 00 200000 LCD 32" ODMZ 0 0 0 Constraints: Objective function: RHS: Initial Budget Product by shipment mode Shipment Min service reg 12,999,999,999 V3,000,000,000 LCD42" - Air/ Express 4600 46000 LCD42" - Road, Road LTL, Road-Network 9200 9200 Total Carbon Emission 7,401,248 LCD42" - Rail 138000 138000 LCD32" - Air/ Express 5300 5300 LCD32" - Road, Road LTL, Road-Network 1950 79500 CD32" - Rail 79500 950DHL%20SC%20SOlution-1 Home Insert Page Layout Formulas Data Review View X Cut Calibri (Body) 11 A- A- Bo Wrap Text General Copy Paste Format B I U A S E CE Merge & Center $ % 4.0 .00 .00 Conditional Fo Formatting as K10 $ X VFX A B C D E F G H K L M % budget increase 0% 2% 3% 4% 6% 8% 10% 12% 14 16% 18 COZ emission kg 7,401,248 5,513,042 4,907,392 4,542,373 3,572,592 3,502,043 3,479,982 3,416,983 3,373,499 3,346,068 3,330,518 (% reduction) 0% 26% 34% 39% 52% 53%% 53% 54% 54% 55% 55% CO2 emission vs % budget increase 8,000,000 7,000,000 6,000,000 5,000,000 4,000,000 3,000,000 2,000,000 1,000,000 0% 2% 3% 4% 6% 8% 10% 12% 14% 16% 18%DHL SUPPLY CHAIN room David Ringrose and Professor Singfat Chu wrote this case solely to provide material for class discussion. The authors do not intend o flustrate either effective or ineffective handling of a managerial situation. The authors may have disguised certain names and other identifying information to protect confidentiality-/ Richard Ivey School of Business Foundation prohibits any form of reproduction, storage of transmission without its written permission. Reproduction of this material is not covered under authorization by any reproduction lights organization. To order copies or request permission to reproduce materials, contact Ivey Publishing, Richard Ivey School of Business Foundation, The University of Western Ontario, London, Ontario, Canada, NGA 3K7; phone (519).661-3208; fax (519) 661-3882; e-mail cases@ivey.uwo.ca Copyright @ 2012, National University of Singapore and Richard Ivey School of Business Foundation Version: 2012-04-19 A 2009 World Economic Forum publication declared, "Human activity generates annual greenhouse gas emissions of around 50,000 mega-tonnes CO2 (Carbon Dioxide emission). We estimate that 2,800 mega- tonnes or 5.5 per cent of the total are contributed by the logistics and transport sector." The executive summary stated, "Significant movement is expected towards reduced supply chain carbon intensity. This will create both opportunities and risks for logistics and transport firms, with changes in supply and demand driven by regulation of carbon emissions, higher and more volatile fuel prices and evolving consumer and client demand. The sector can play an influential role in decarbonization, both in its own operations and through broader supply chain optimization. This provides direct benefits through reduced costs, managed risks and business growth" It concluded with several recommendations for supply chain stakeholders. Among the six recommendations for logistics and transport providers was to "switch (transport) modes where possible." For shippers and buyers, it was recommended to "plan to allow slower and better optimized transport." Finally, policy makers were also invited to "reflect the cost of carbon in energy tariffs; support carbon measurement and labeling standards and build open carbon trading systems." COMPANY INFORMATION > After reading the report, Yee Hwai, a member of the solutions team at DHL Supply Chain, recognized the very findings he had uncovered in a recent simulation analysis, undertaken as part of the Go Green environmental protection program initiated by parent firm, Deutsche Post DHL. As the thought leader on sustainability in the industry, Deutsche Post DHL recognized there were clear opportunities to begin resolving the carbon emission problems faced by many of its customers. DHL even stated on its website,"We recognize environmental protection as our responsibility as well as a business opportunity." Deutsche Post DHL was the first logistics company to set a quantified carbon efficiency goal to improve its CO2 efficiency across global operations by 30 per cent compared to the 2007 baseline THE PROBLEM The simulation exercise Hwai undertook pertained to a consumer electronics company (CEC) Prominent among its line of products were 32" and 42" LCD TV sets (1.CD32" and LCD42"), Production of the LCD TV sets was subcontracted to various original design manufacturers (ODMs) located in China and Taiwan. The responsibility of DHL Supply Chain was to ship the LCD TV sets from the ODMs to the distribution centre (DC) located in Shanghai. In the latest contract, the CEC had allocated a budget of CNY 3 billion (Chinese renminbi) for the production and shipping of 920,000 units of LCD42" and 530,000 units of LCD32" TV sets to its DC. Hwai had worked with the CEC to configure the optimal supply chain that would fulfill this order within the CNY 3 billion budget while satisfying various constraints pertaining to economy of scale, production capacity, supplier risk management and service level requirements on the shipping front. At that point, this optimization exercise did not consider the volume of CO2 emissions. The CEC had a list of seven ODMs to which it could subcontract the production of LCD TV sets according to their availability and prices. ODM) and ODM2 were the only companies that could produce both LCD32" and LCD42". The remaining five ODM produced LCD42" exclusively. Their unit production costs are listed in the data sheet (see Exhibit 1)) To engender economies of scale in the production, the CEC guaranteed a minimum order of 200 000 to any selected ODMs. Also, to mitigate dependency risk on any ODM, the maximum order for either LCD32" or LCD42" was capped at 600,000 units. ODM1 and ODM2 bad high production capacities and, if chosen, they each had the ability to produce 600,000 units of LCD32", as well as 600 000 units of LCD42". Several transportation modes were available to skip the TV sets from the ODMs to the DC: regular air, air express/road, road LIL (less than truckload), road network, rail and water. The distances from the ODMs to the DC and the various shipping rates are tabulated in the data sheet. ODMS was located near the DC, restricting shipping to road, road LIL and road network. ODM6 was located in Taiwan and shipping could only be conducted via air or water. Across shipping modes, the rates of carbon emission (see data Sheet in Exhibit 1) varied greatly from as high as 1.44 (regular air or air express) to 0.007 (water) kilogram (kg) per ton shipped per kilometer (km) travelled Each LCD32" weighed about 16.5 kgs and each LCD42" weighed about 22 bup Shipping times varied from two days (via air express) to 10 days (via water). Based on historical information on shipping times and customer order cycle times, the CEC decided that to maintain satisfactory inventory levels. DHL Supply Chain had to ship a minimum number of 32" and 42" LCD TV sets, according to the criteria listed at the bottom of the data sheet below (see Exhibit 1). There was no constraint on shipments via water. In the simulation exercise, Hwai assumed a likely consequence of government legislation to reduce the emission of CO2 would appear in the form of a tax incentive. He also anticipated the brand value of the LCD TV sets could rise as a result of customer awareness. Hwai estimated these factors could translate into a 10 per cent increase in the budget for this specific supply chain. He was eager to find out the potential reduction in CO2 emission made possible through a potential CNY 3.3 billion budget for manufacturing and shipping the TVs from the ODMs to the DC. 'www.op-chlconventresponsibilityenvironment.html, accessed April 2012
Step by Step Solution
There are 3 Steps involved in it

Get step-by-step solutions from verified subject matter experts