

Question: How do I analyze whether or not there is a correlation with anxiety and exams scores based on the chart? Normal P-P Plot of Regression
How do I analyze whether or not there is a correlation with anxiety and exams scores based on the chart?
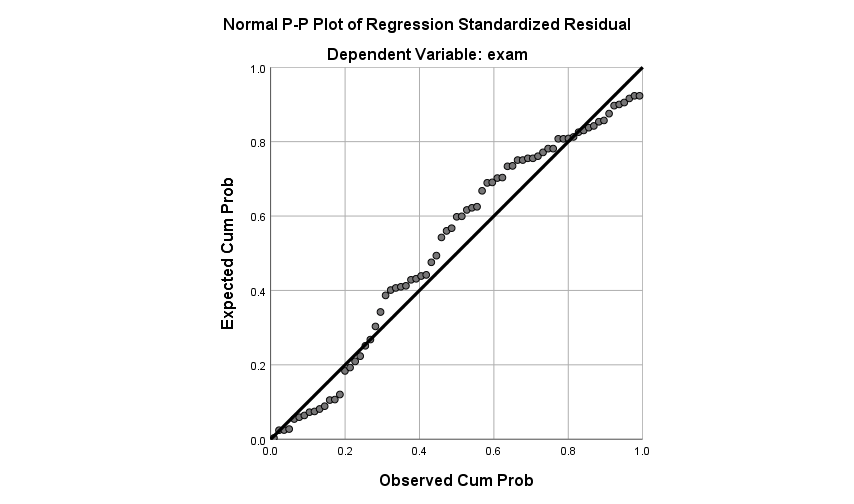
Normal P-P Plot of Regression Standardized Residual Dependent Variable: exam Expected Cum Prob be [1.2 (1.4 [1.6 [1.3 Observed Cum Prob \"ID
Step by Step Solution
There are 3 Steps involved in it
1 Expert Approved Answer
Step: 1 Unlock

Question Has Been Solved by an Expert!
Get step-by-step solutions from verified subject matter experts
Step: 2 Unlock
Step: 3 Unlock