

Question: How do I calculate a one sample t-testin excel with the values below, as well as using the image attached? what are the steps/commands needed

How do I calculate a one sample t-testin excel with the values below, as well as using the image attached? what are the steps/commands needed to place in excel
H0 : =22.684 Ha :
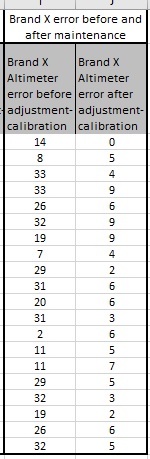
Brand X error before and after maintenance Brand X Brand X Altimeter Altimeter error before | error after adjustment-| adjustment- calibration |calibration 14 33 33 26 32 19 7 29 31 20 31 2 11 11 29 32 19 26 32
Step by Step Solution
There are 3 Steps involved in it
1 Expert Approved Answer
Step: 1 Unlock

Question Has Been Solved by an Expert!
Get step-by-step solutions from verified subject matter experts
Step: 2 Unlock
Step: 3 Unlock