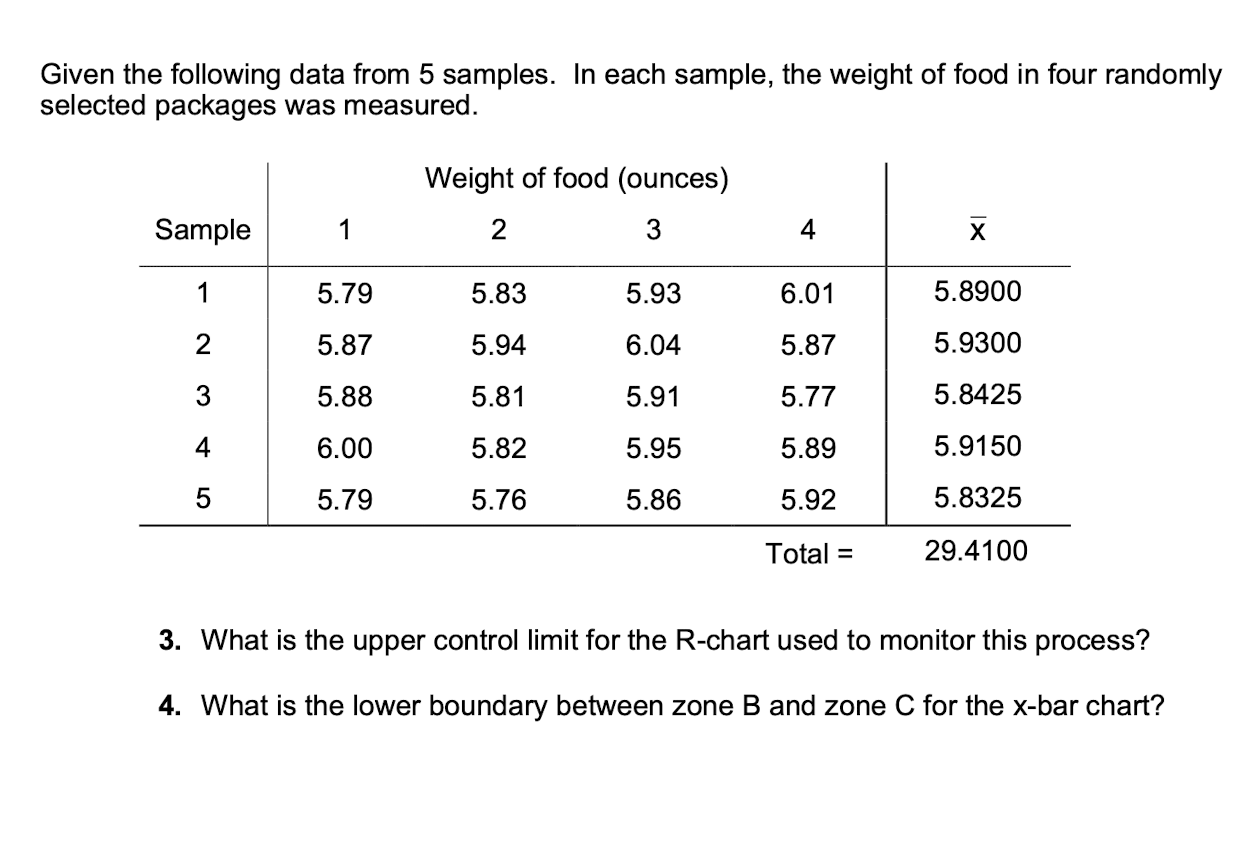
Question: How do I calculate R? Given the following data from 5 samples. In each sample, the weight of food in four randomly selected packages was

How do I calculate R? Given the following dataHow do I calculate R?

Given the following data from 5 samples. In each sample, the weight of food in four randomly selected packages was measured. Weight of food (ounces) 2 3 Sample 1 4 X 1 5.79 5.83 5.93 6.01 5.8900 2 5.87 5.94 6.04 5.87 5.9300 3 5.88 5.81 5.91 5.77 5.8425 4 6.00 5.82 5.95 5.89 5.9150 5 5.79 5.76 5.86 5.92 5.8325 Total = 29.4100 3. What is the upper control limit for the R-chart used to monitor this process? 4. What is the lower boundary between zone B and zone C for the x-bar chart

Step by Step Solution

There are 3 Steps involved in it

1 Expert Approved Answer
Step: 1 Unlock blur-text-image
Question Has Been Solved by an Expert!

Get step-by-step solutions from verified subject matter experts

Step: 2 Unlock
Step: 3 Unlock

Students Have Also Explored These Related General Management Questions!