

Question: how do i comment on the ratio as asked in the task? I'm not sure how to work that out Bar Chart 25 Maternal smoking
how do i comment on the ratio as asked in the task? I'm not sure how to work that out
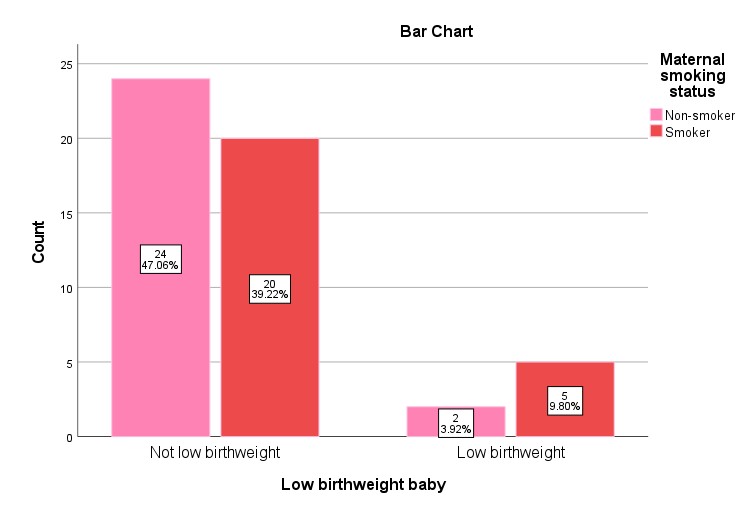
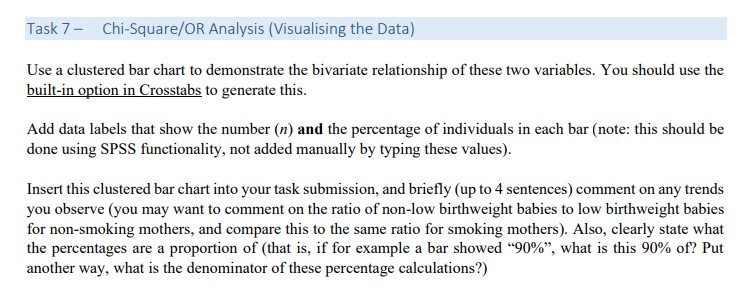
Bar Chart 25 Maternal smoking status Non-smoker 20 Smoker 15 Count 24 47.06% 10 20 39.22% 5 5 9.80% 2 3.92% Not low birthweight Low birthweight Low birthweight babyTask T\" * Chi-SquarefDR Analysis {'v'isualising the Data] Use a clustered bar chart to demonstrate the bivariate relationship of these two variables. You should use the built-in olltion in Crosstabs to generate this. Add data labels that show the number {a} and the percentage of individuals in each bar (note: this should be done using SPSS mctiornality, not added manually by typing these values). Inser1 this clustered bar chart into your task submission, and briey (up to 4 sentences] comment on any trends you observe [you may want to comment on the ratio ofnon-low birdiweight babies to low birthweight babies for non-smoking mothers, and compare this to the same ratio for smoking mothers). Also, clearly state what the percentages are a proportion of (that is, if for example a bar showed wow\
Step by Step Solution
There are 3 Steps involved in it

Get step-by-step solutions from verified subject matter experts