

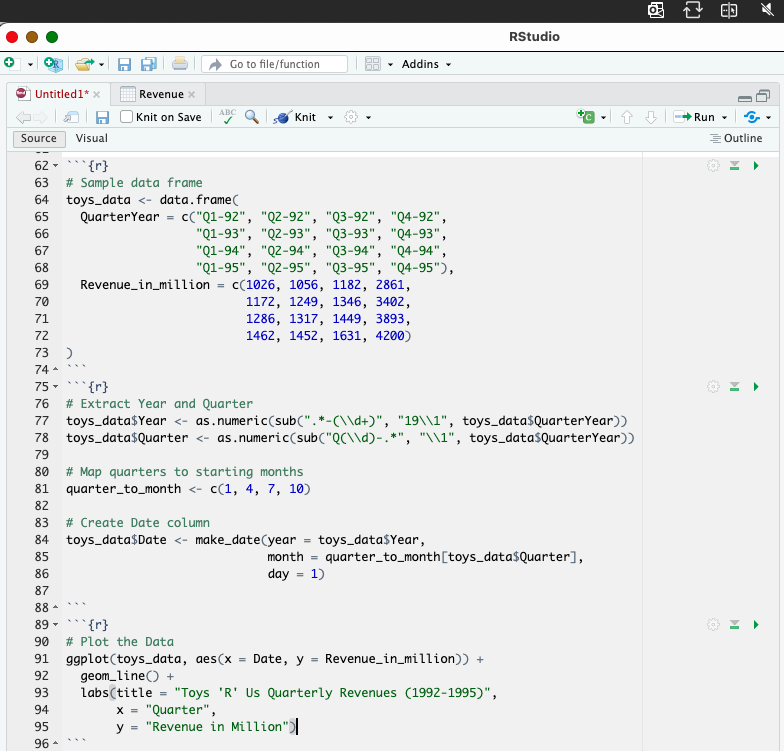
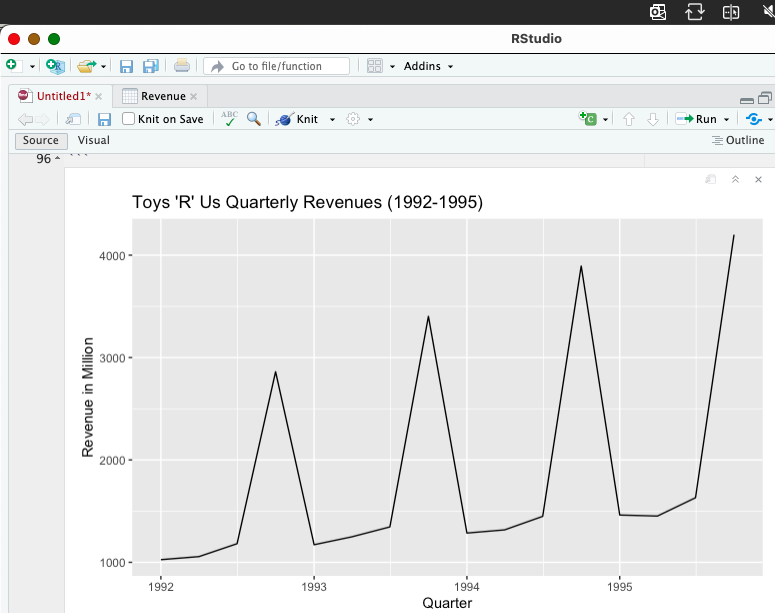
Question: How do I construct the visual to display in individual quarters i.e. Q1/92, Q2/92, Q3/92, etc. . . . RStudio + . 9 3 .|
How do I construct the visual to display in individual quarters i.e. Q1/92, Q2/92, Q3/92, etc.
Step by Step Solution
There are 3 Steps involved in it
1 Expert Approved Answer
Step: 1 Unlock

Question Has Been Solved by an Expert!
Get step-by-step solutions from verified subject matter experts
Step: 2 Unlock
Step: 3 Unlock