

Question: How do I create the different scatter plots from the dataset? Here is the project info The Fresh Detergent Case Enterprise Industries produces Fresh, a
How do I create the different scatter plots from the dataset?
Here is the project info
The Fresh Detergent Case
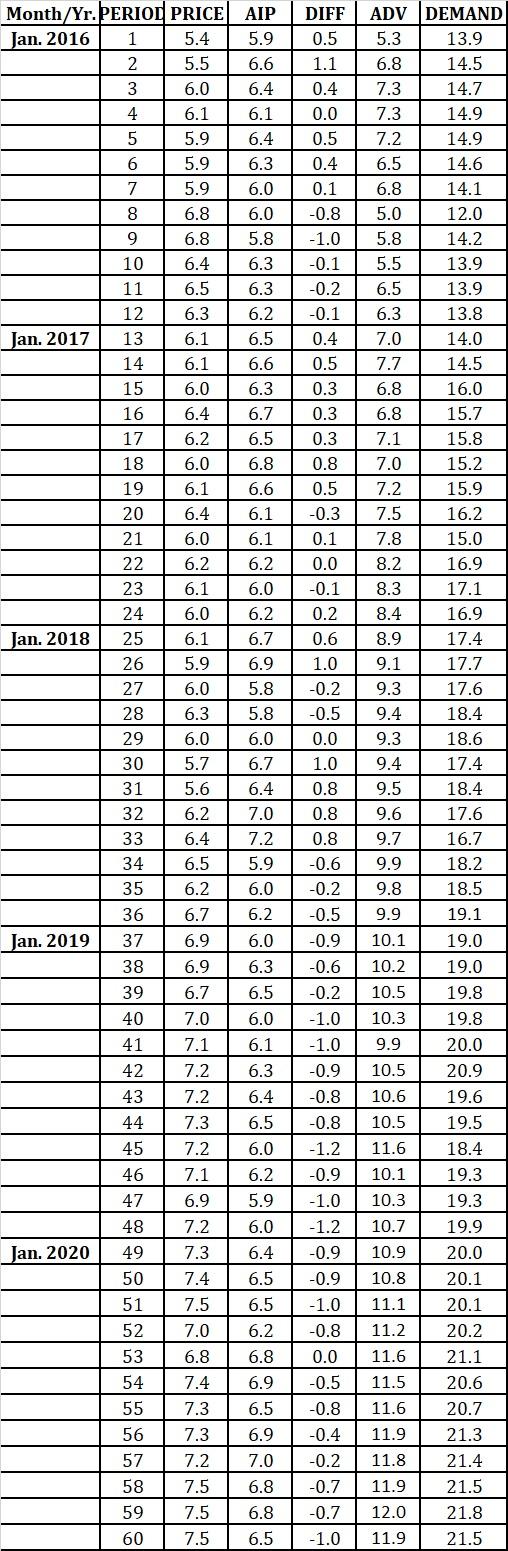
Enterprise Industries produces Fresh, a brand of liquid detergent. In order to more effectively manage its inventory, the company would like to better predict demand for Fresh. To develop a prediction model, the company has gathered data concerning demand for Fresh over the last 60 sales periods. Each sales period is defined as one month. The variables are as follows:
Demand = Y = demand for a large size bottle of Fresh (in 100,000)
Price = the price of Fresh as offered by Ent. Industries
AIP = the average industry price
ADV = Ent. Industries Advertising Expenditure (in $100,000) to Promote Fresh in the sales period.
DIFF = AIP - Price = the "price difference" in the sales period
- Make time series scatter plots of all five variables (five graphs). Insert trend line, equation, and R-squared. Observe graphs and provide interpretation of results.
I do not know how to make scatter plots - please provide step by steps on how to create the scatter plots from the data set.
I do not need any else - except how to create the five scatter plots from the one data set - please help.
7.3 DIFF 0.5 1.1 0.4 0.0 0.5 0.4 0.1 -0.8 -1.0 -0.1 -0.2 -0.1 0.4 0.5 0.3 0.3 0.3 0.8 0.5 -0.3 0.1 0.0 13.8 -0.1 Month/Yr. PERIOD PRICE AIP Jan. 2016 1 5.4 5.9 2 5.5 6.6 3 6.0 6.4 4 6.1 6.1 5 5.9 6.4 6 5.9 6.3 7 5.9 6.0 8 6.8 6.0 9 6.8 5.8 10 6.4 6.3 11 6.5 6.3 12 6.3 6.2 Jan. 2017 13 6.1 6.5 14 6.1 6.6 15 6.0 6.3 16 6.4 6.7 17 6.2 6.5 18 6.0 6.8 19 6.1 6.6 20 6.4 6.1 21 6.0 6.1 22 6.2 6.2 23 6.1 6.0 24 6.0 6.2 Jan. 2018 25 6.1 6.7 26 5.9 6.9 27 6.0 5.8 28 6.3 5.8 29 6.0 6.0 30 5.7 6.7 31 6.4 32 6.2 7.0 33 6.4 7.2 34 6.5 5.9 35 6.2 6.0 36 6.7 6.2 Jan. 2019 37 6.9 6.0 38 6.9 6.3 39 6.7 6.5 40 7.0 6.0 41 7.1 6.1 42 7.2 6.3 43 7.2 6.4 44 7.3 6.5 45 7.2 6.0 46 7.1 6.2 47 6.9 5.9 48 7.2 6.0 Jan. 2020 49 7.3 6.4 50 7.4 6.5 51 7.5 6.5 52 7.0 6.2 53 6.8 6.8 54 7.4 6.9 55 7.3 6.5 56 7.3 6.9 57 7.0 58 7.5 6.8 59 7.5 6.8 60 7.5 6.5 0.2 0.6 1.0 -0.2 -0.5 0.0 1.0 0.8 0.8 0.8 -0.6 -0.2 ADV DEMAND 5.3 13.9 6.8 14.5 14.7 7.3 14.9 7.2 14.9 6.5 14.6 6.8 14.1 5.0 12.0 5.8 14.2 5.5 13.9 6.5 13.9 6.3 7.0 14.0 7.7 14.5 6.8 16.0 6.8 15.7 7.1 15.8 7.0 15.2 7.2 15.9 7.5 16.2 7.8 15.0 8.2 16.9 8.3 17.1 8.4 16.9 8.9 17.4 9.1 17.7 9.3 17.6 9.4 18.4 9.3 18.6 9.4 17.4 9.5 18.4 9.6 17.6 9.7 16.7 9.9 18.2 9.8 18.5 9.9 19.1 10.1 19.0 10.2 19.0 10.5 19.8 10.3 19.8 9.9 20.0 10.5 20.9 10.6 19.6 10.5 19.5 11.6 18.4 10.1 19.3 10.3 19.3 10.7 19.9 10.9 20.0 10.8 20.1 11.1 20.1 11.2 20.2 11.6 21.1 11.5 20.6 11.6 20.7 11.9 21.3 11.8 21.4 11.9 21.5 12.0 21.8 11.9 21.5 5.6 -0.5 -0.9 -0.6 -0.2 -1.0 -1.0 -0.9 -0.8 -0.8 -1.2 -0.9 -1.0 -1.2 -0.9 Ollola -0.9 -1.0 -0.8 0.0 -0.5 -0.8 -0.4 -0.2 -0.7 -0.7 -1.0 7.2 ma
Step by Step Solution
There are 3 Steps involved in it

Get step-by-step solutions from verified subject matter experts