

Question: How do I create the picture with the circles in python? I'm probably not doing this right, but this is what I have so far:
How do I create the picture with the circles in python? I'm probably not doing this right, but this is what I have so far:
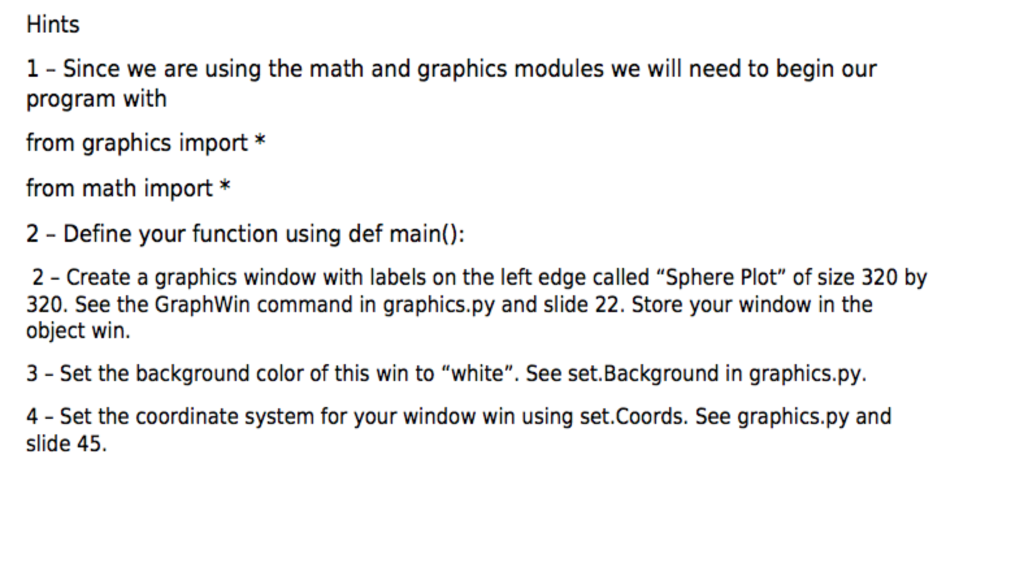
from graphics import * from math import *
def main(): win = GraphWin("Sphere Plot", 320, 320) win.setBackground("white") win.setCoords(0.0, -5.0, 0.0, 5.0)
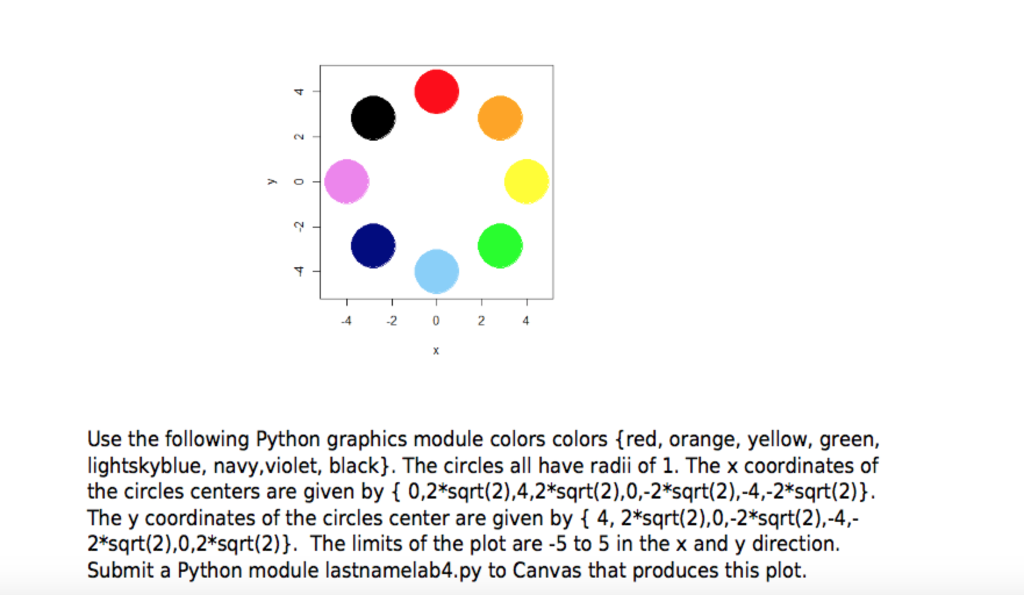

.2 Use the following Python graphics module colors colors [red, orange, yellow, green, lightskyblue, navy,violet, blackj. The circles all have radi of 1. The x coordinates of the circles centers are given by 0,2*sqrt(2),4,2*sqrt(2),0,-2*sqrt(2),-4,-2*sqrt(2)). The y coordinates of the circles center are given by { 4, 2*sqrt(2),0,-2*sqrt(2-4,- 2*sqrt(2),0,2*sqrt(2). The limits of the plot are-5 to 5 in the x and y direction. Submit a Python module lastnamelab4.py to Canvas that produces this plot
Step by Step Solution
There are 3 Steps involved in it

Get step-by-step solutions from verified subject matter experts