

Question: How do I create these charts using excel? (Rocket Fuel Case Study) Any advice for a solution helps!! 4. How does consumer response to advertising
How do I create these charts using excel? (Rocket Fuel Case Study) Any advice for a solution helps!! 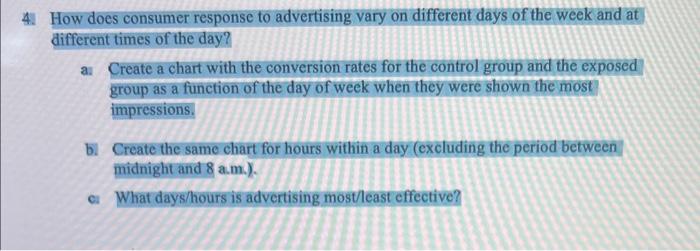
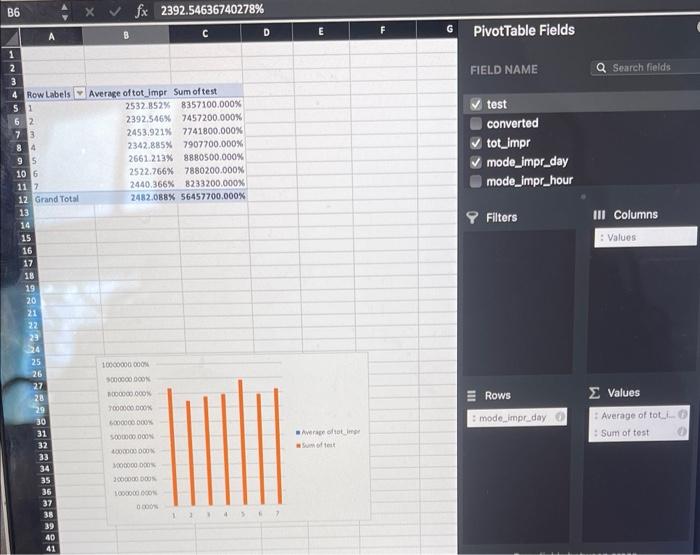
4. How does consumer response to advertising vary on different days of the week and at different times of the day? as Create a chart with the conversion rates for the control group and the exposed group as a function of the day of week when they were shown the most impressions. b. Create the same chart for hours within a day (excluding the period between midnight and 8 a.m.). c What days/hours is advertising most/least cffective
Step by Step Solution
There are 3 Steps involved in it
1 Expert Approved Answer
Step: 1 Unlock

Question Has Been Solved by an Expert!
Get step-by-step solutions from verified subject matter experts
Step: 2 Unlock
Step: 3 Unlock