

Question: How do i create this matlab plot for scatter plot Recreate the following five figures using MATLAB (20pts each). Ensure that lines/line styles, titles, axis
How do i create this matlab plot for scatter plot 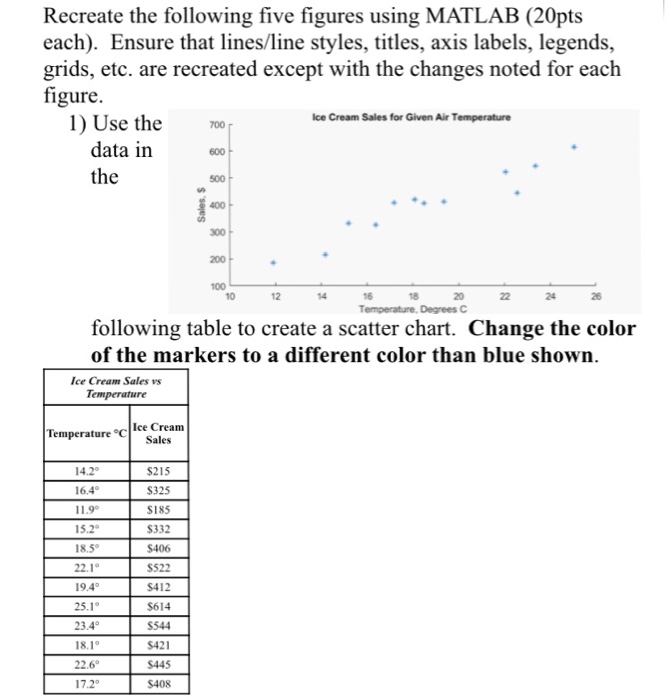
Recreate the following five figures using MATLAB (20pts each). Ensure that lines/line styles, titles, axis labels, legends, grids, etc. are recreated except with the changes noted for each figure. Ice Cream Sales for Given Air Temperature 1) Use the 700 data in the 600 500 300 100 12 24 Temperature, Degrees C following table to create a scatter chart. Change the color of the markers to a different color than blue shown Ice Cream Sales vs Temperature C Ice Cream Sales 14.2 16.4 11.9 15.2 18.5 22.1 19.4 25.1 23.4 18.1 22.6 17.2 $215 S185 S332 $406 S522 $412 $614 S544 S421 445 S408
Step by Step Solution
There are 3 Steps involved in it
1 Expert Approved Answer
Step: 1 Unlock

Question Has Been Solved by an Expert!
Get step-by-step solutions from verified subject matter experts
Step: 2 Unlock
Step: 3 Unlock