

Question: How do I determine the information on the histograph and input that information given to me on the table? 3. Consider the graph below: 16
How do I determine the information on the histograph and input that information given to me on the table?
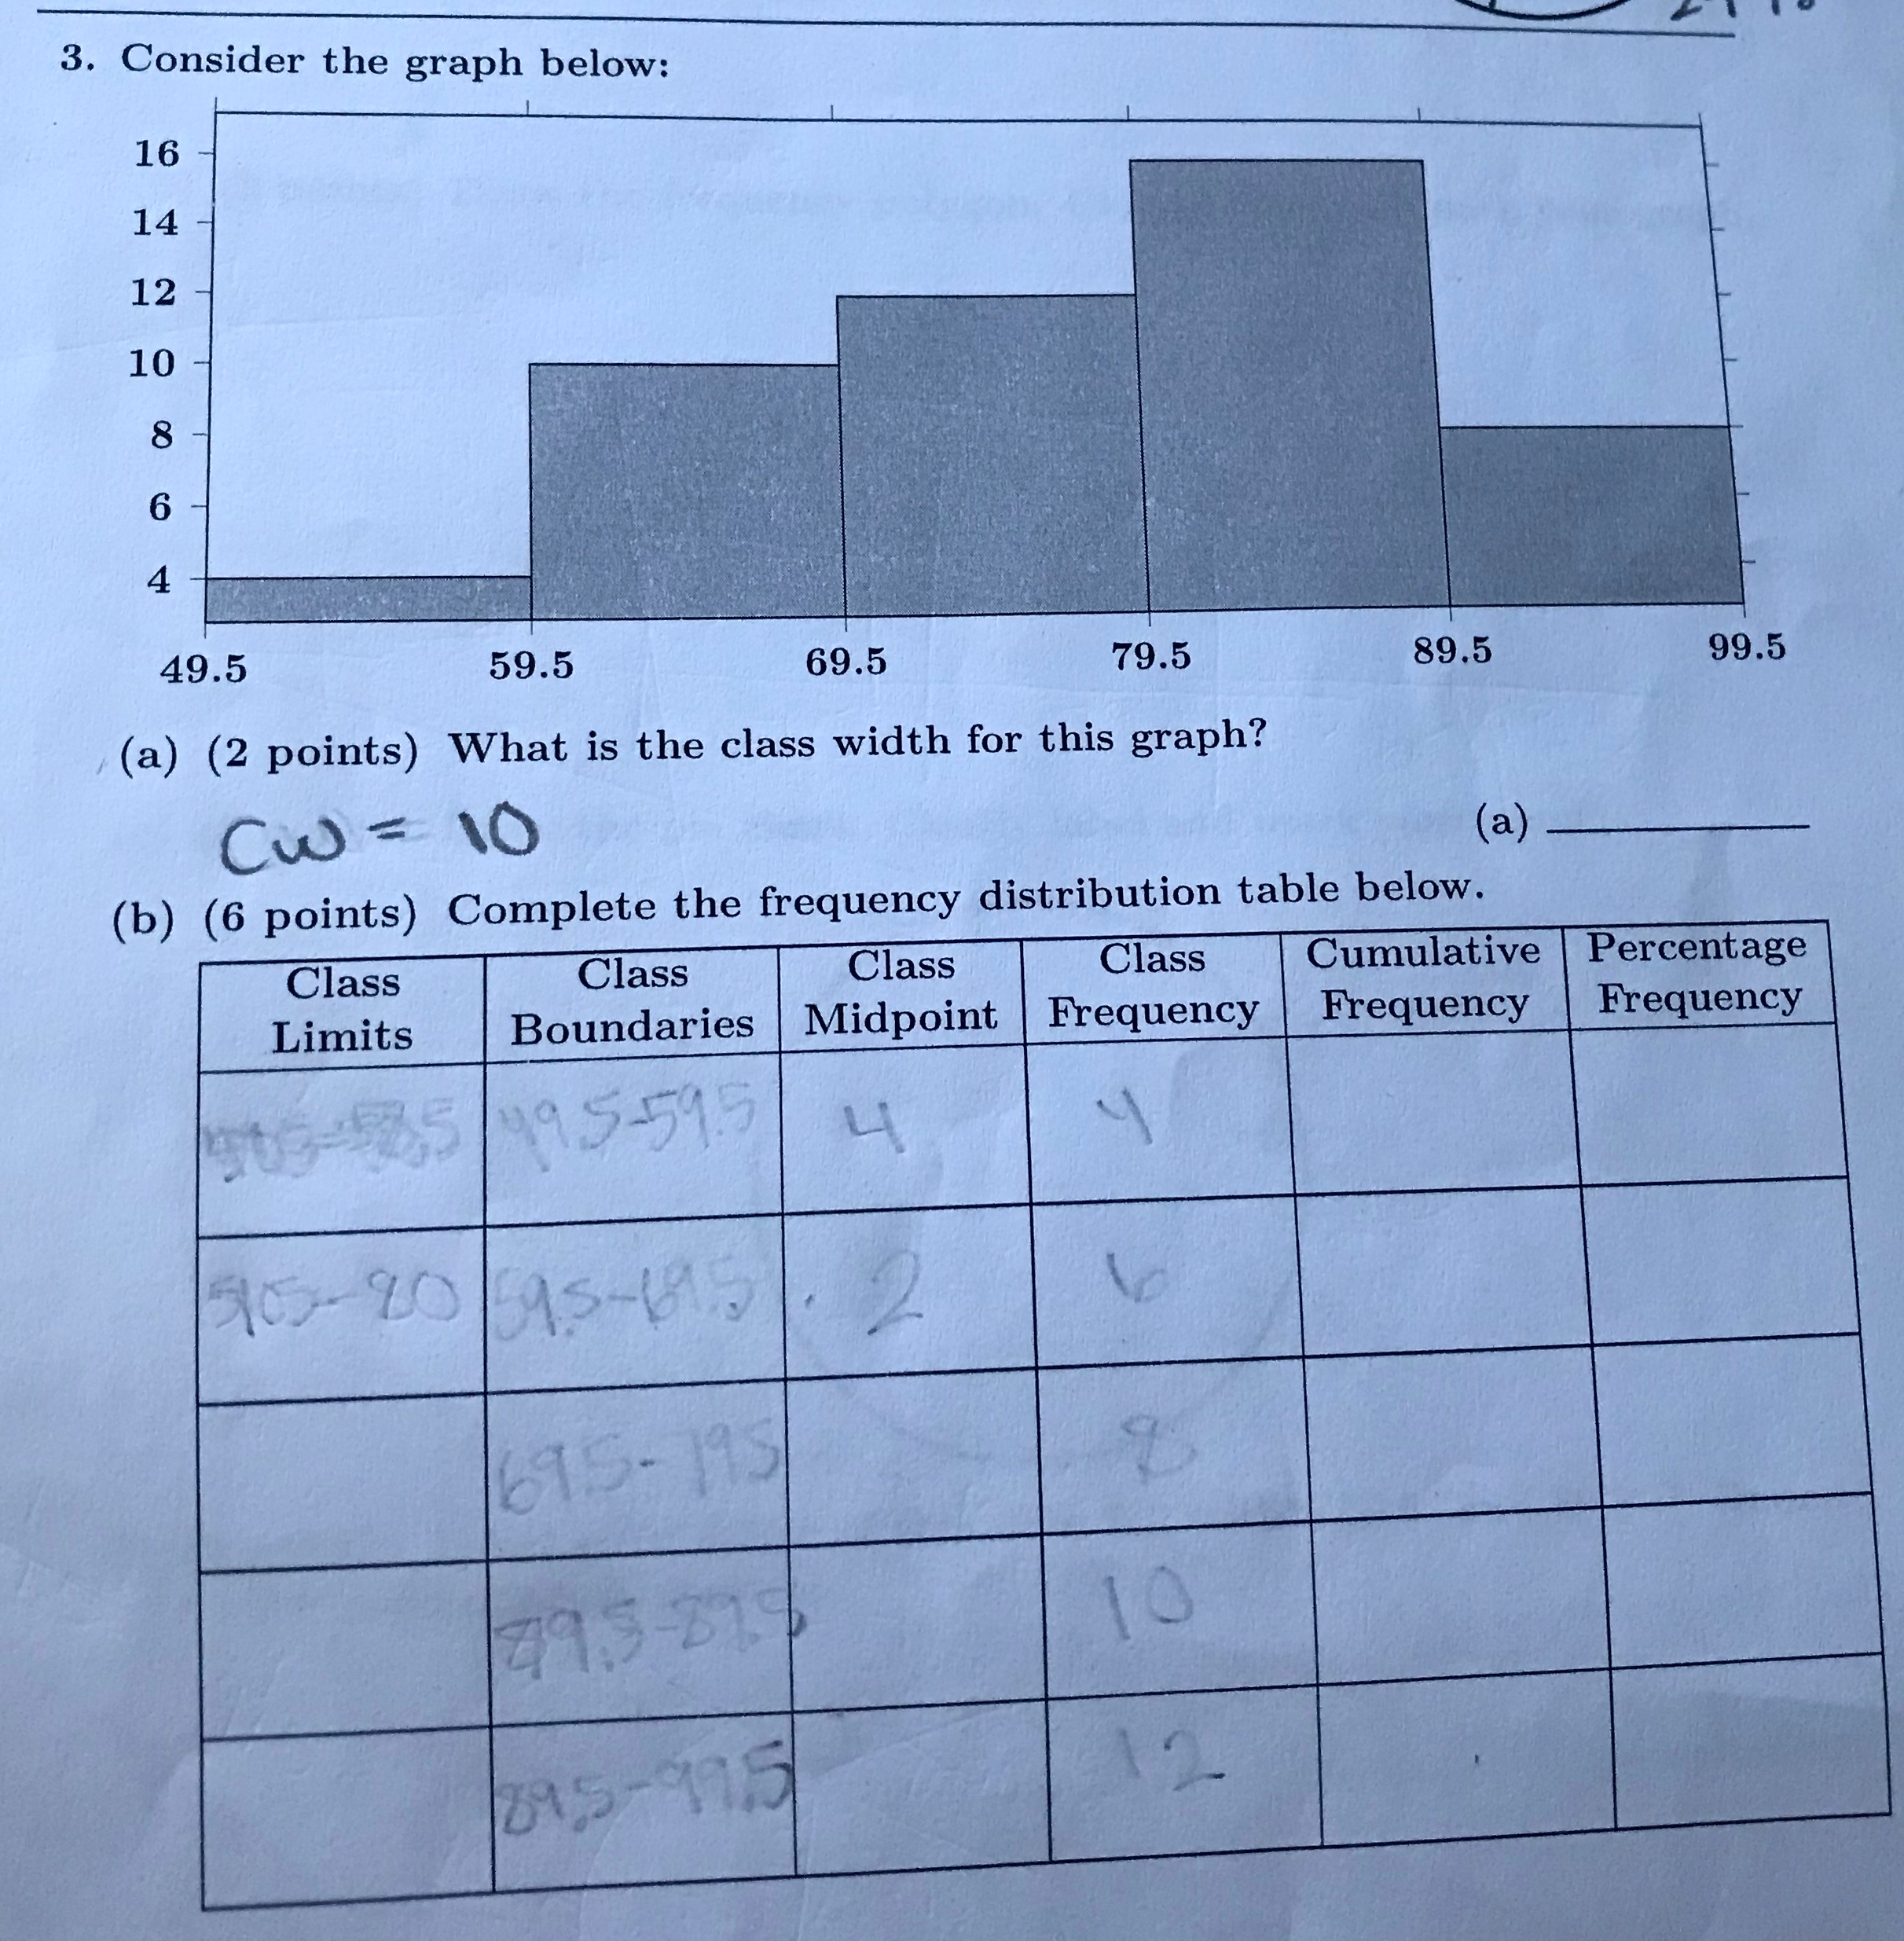
3. Consider the graph below: 16 14 12 10 8 6 4 49.5 59.5 69.5 79.5 89.5 99.5 (a) (2 points) What is the class width for this graph? CW = 10 (a) (b) (6 points) Complete the frequency distribution table below. Class Class Class Class Cumulative Percentage Limits Boundaries Midpoint Frequency Frequency Frequency 195-595 4 50- 80 95- 617). 2 1695-195 10 895-995 12
Step by Step Solution
There are 3 Steps involved in it
1 Expert Approved Answer
Step: 1 Unlock

Question Has Been Solved by an Expert!
Get step-by-step solutions from verified subject matter experts
Step: 2 Unlock
Step: 3 Unlock