

Question: How do I do this in Matlab? Section #1: The solution to a system resulted in the sum of two exponential terms described below y(t)
How do I do this in Matlab?
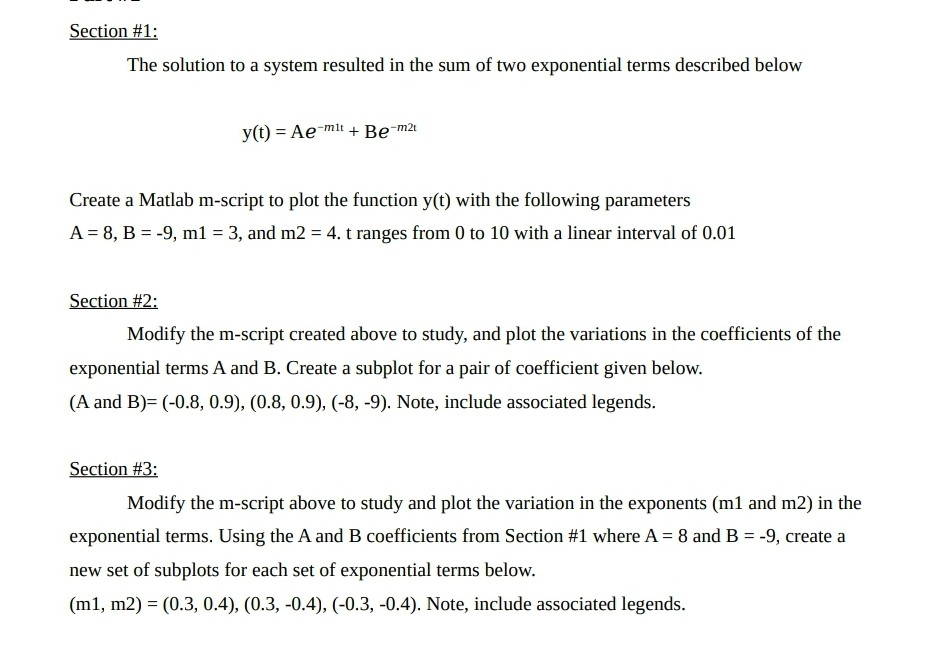
Section #1: The solution to a system resulted in the sum of two exponential terms described below y(t) = Ae-mlt + Be-mat Create a Matlab m-script to plot the function y(t) with the following parameters A = 8, B = -9, m1 = 3, and m2 = 4. t ranges from 0 to 10 with a linear interval of 0.01 Section #2: Modify the m-script created above to study, and plot the variations in the coefficients of the exponential terms A and B. Create a subplot for a pair of coefficient given below. (A and B)= (-0.8, 0.9), (0.8, 0.9), (-8, -9). Note, include associated legends. Section #3: Modify the m-script above to study and plot the variation in the exponents (m1 and m2) in the exponential terms. Using the A and B coefficients from Section #1 where A = 8 and B = -9, create a new set of subplots for each set of exponential terms below. (m1, m2) = (0.3, 0.4), (0.3,-0.4), (-0.3,-0.4). Note, include associated legends
Step by Step Solution
There are 3 Steps involved in it

Get step-by-step solutions from verified subject matter experts