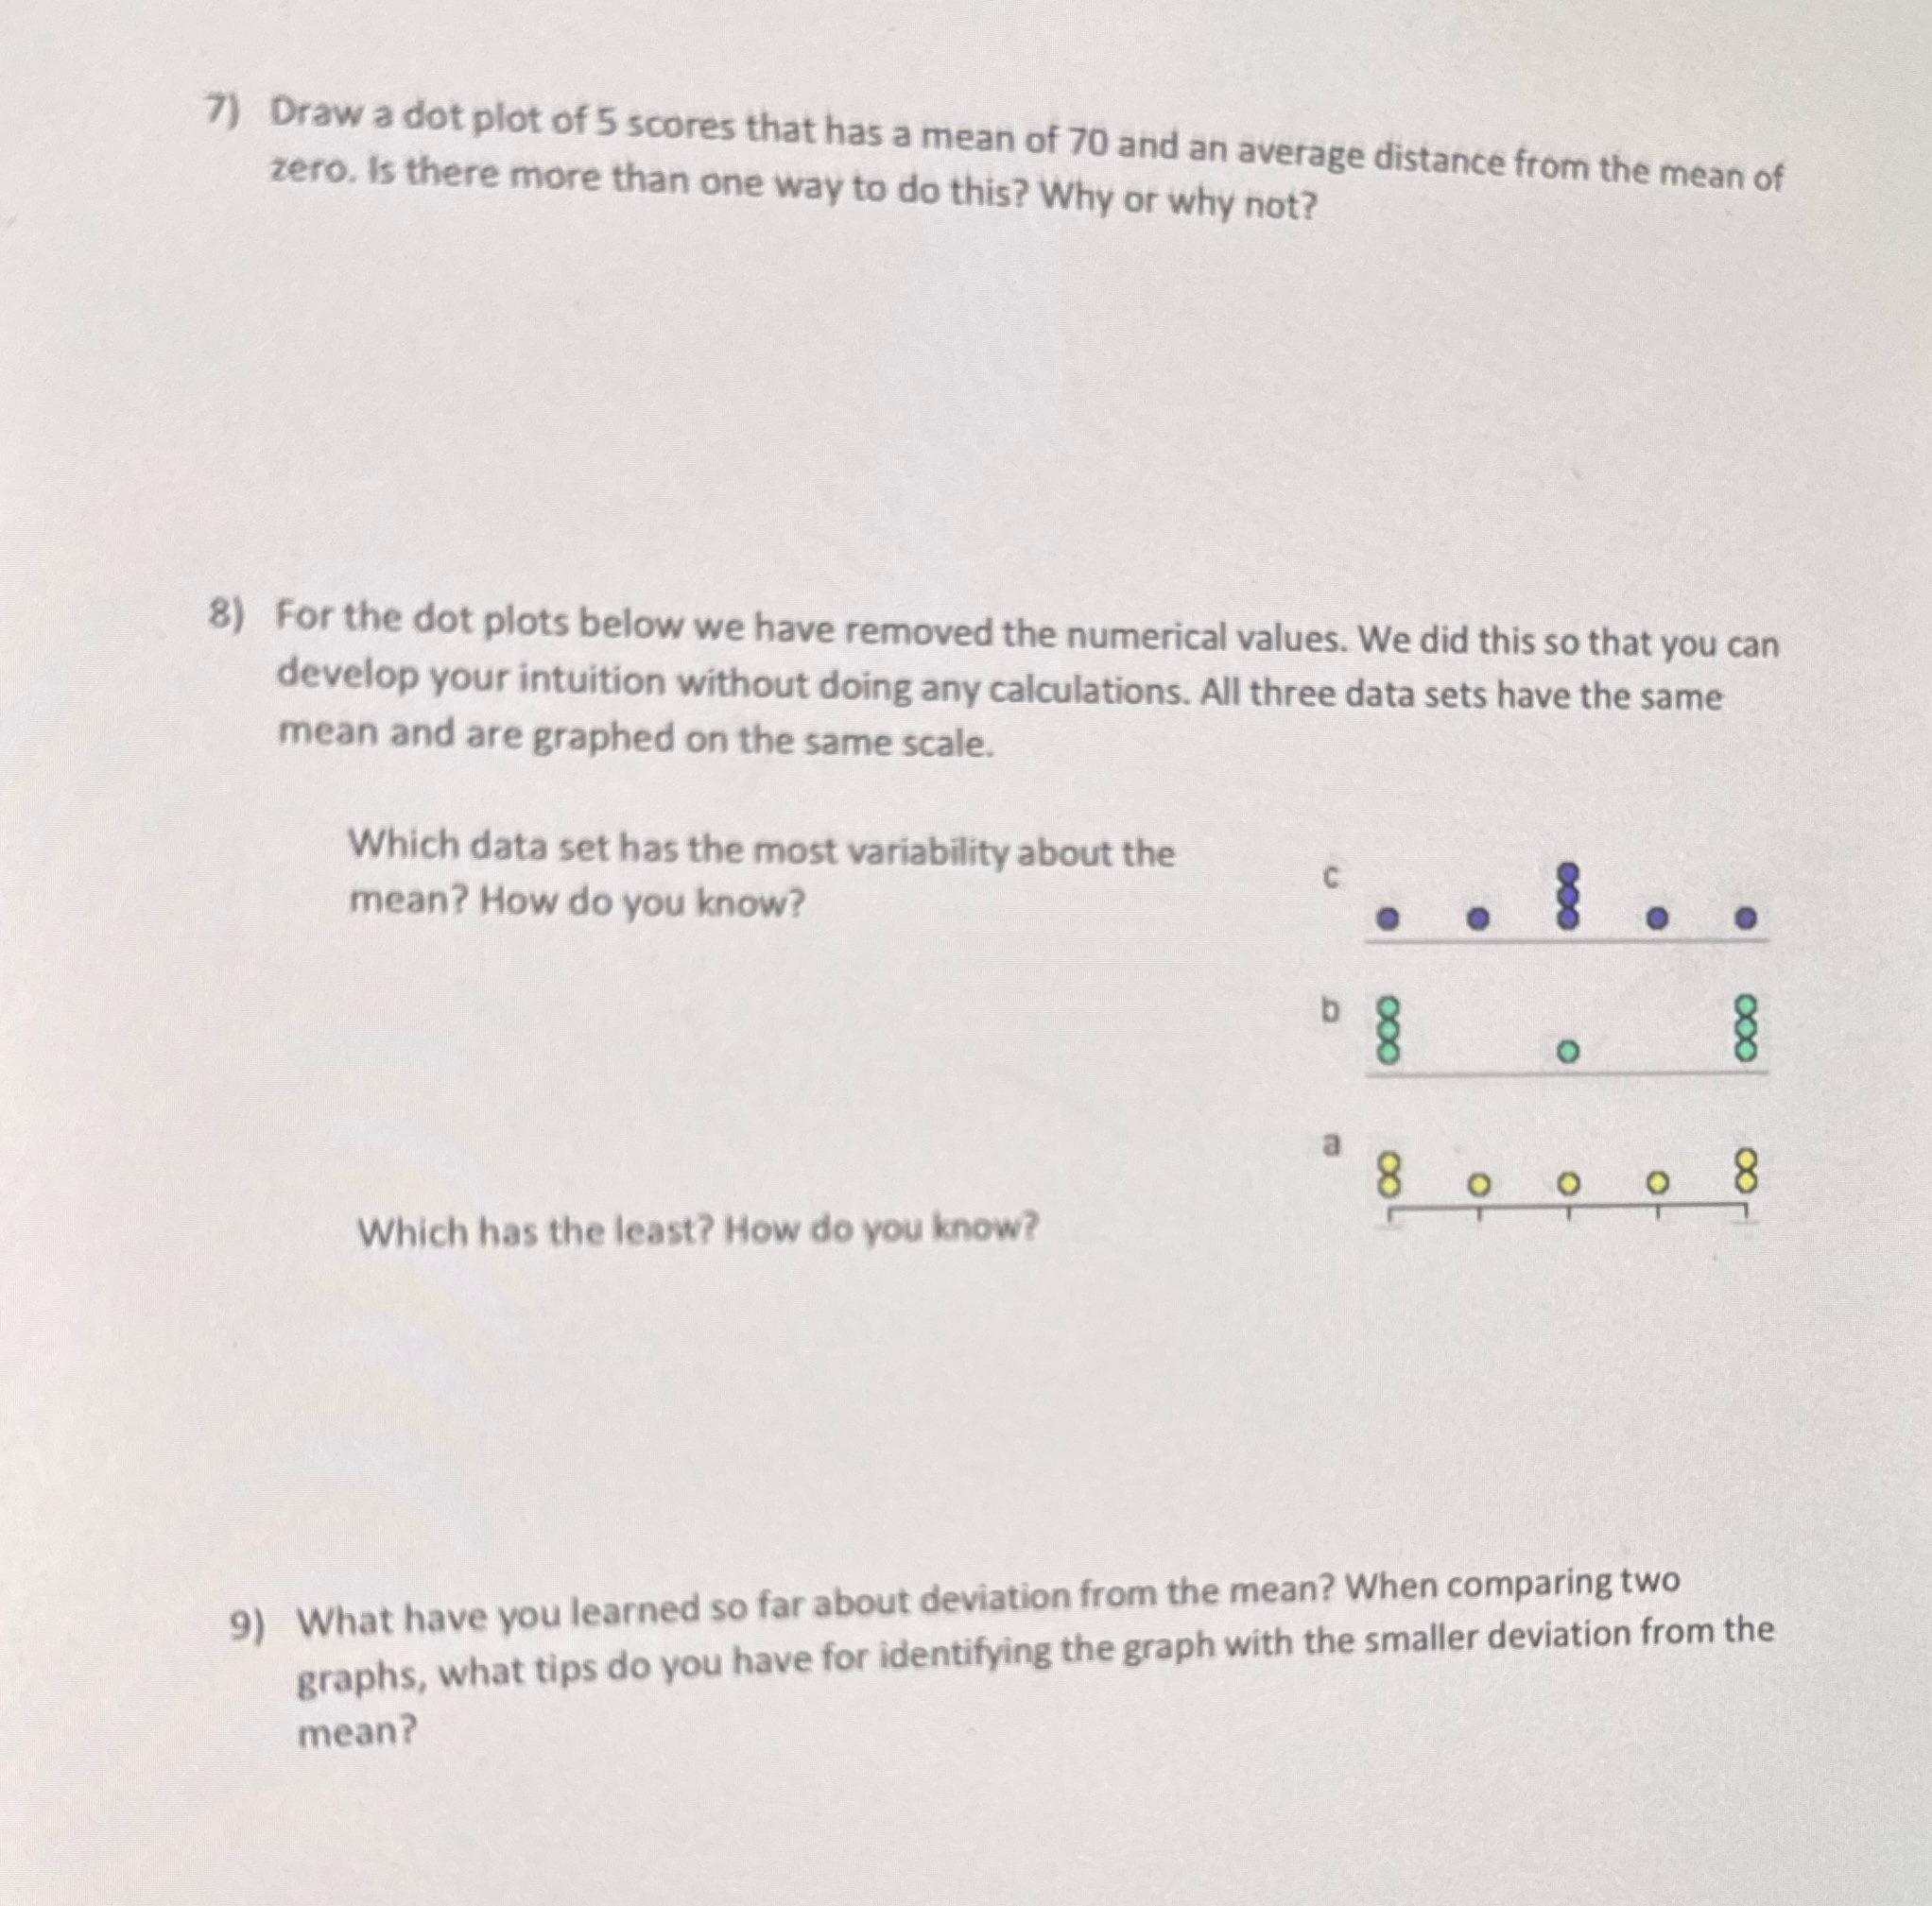
Question: How do I draw 7) ? 7) Draw a dot plot of 5 scores that has a mean of 70 and an average distance from

How do I draw 7) ?

How do I draw 7) ? 7) Draw a dot plot of 5 scores
7) Draw a dot plot of 5 scores that has a mean of 70 and an average distance from the mean of zero. Is there more than one way to do this? Why or why not? 8) For the dot plots below we have removed the numerical values. We did this so that you can develop your intuition without doing any calculations. All three data sets have the same mean and are graphed on the same scale. Which data set has the most variability about the C mean? How do you know? 10OO 1000 O a 8 O 8 Which has the least? How do you know? 9) What have you learned so far about deviation from the mean? When comparing two graphs, what tips do you have for identifying the graph with the smaller deviation from the mean

Step by Step Solution

There are 3 Steps involved in it

1 Expert Approved Answer
Step: 1 Unlock blur-text-image
Question Has Been Solved by an Expert!

Get step-by-step solutions from verified subject matter experts

Step: 2 Unlock
Step: 3 Unlock

Students Have Also Explored These Related Accounting Questions!