

Question: PLEASE ANSWER WITHIN 20 MINS WITH SHOWING WORK FOR FULL BEST FEEDBACK. Question Completion Status: QUESTION 14 A diagram of the Central Limit Theorem shows

PLEASE ANSWER WITHIN 20 MINS WITH SHOWING WORK FOR FULL BEST FEEDBACK.


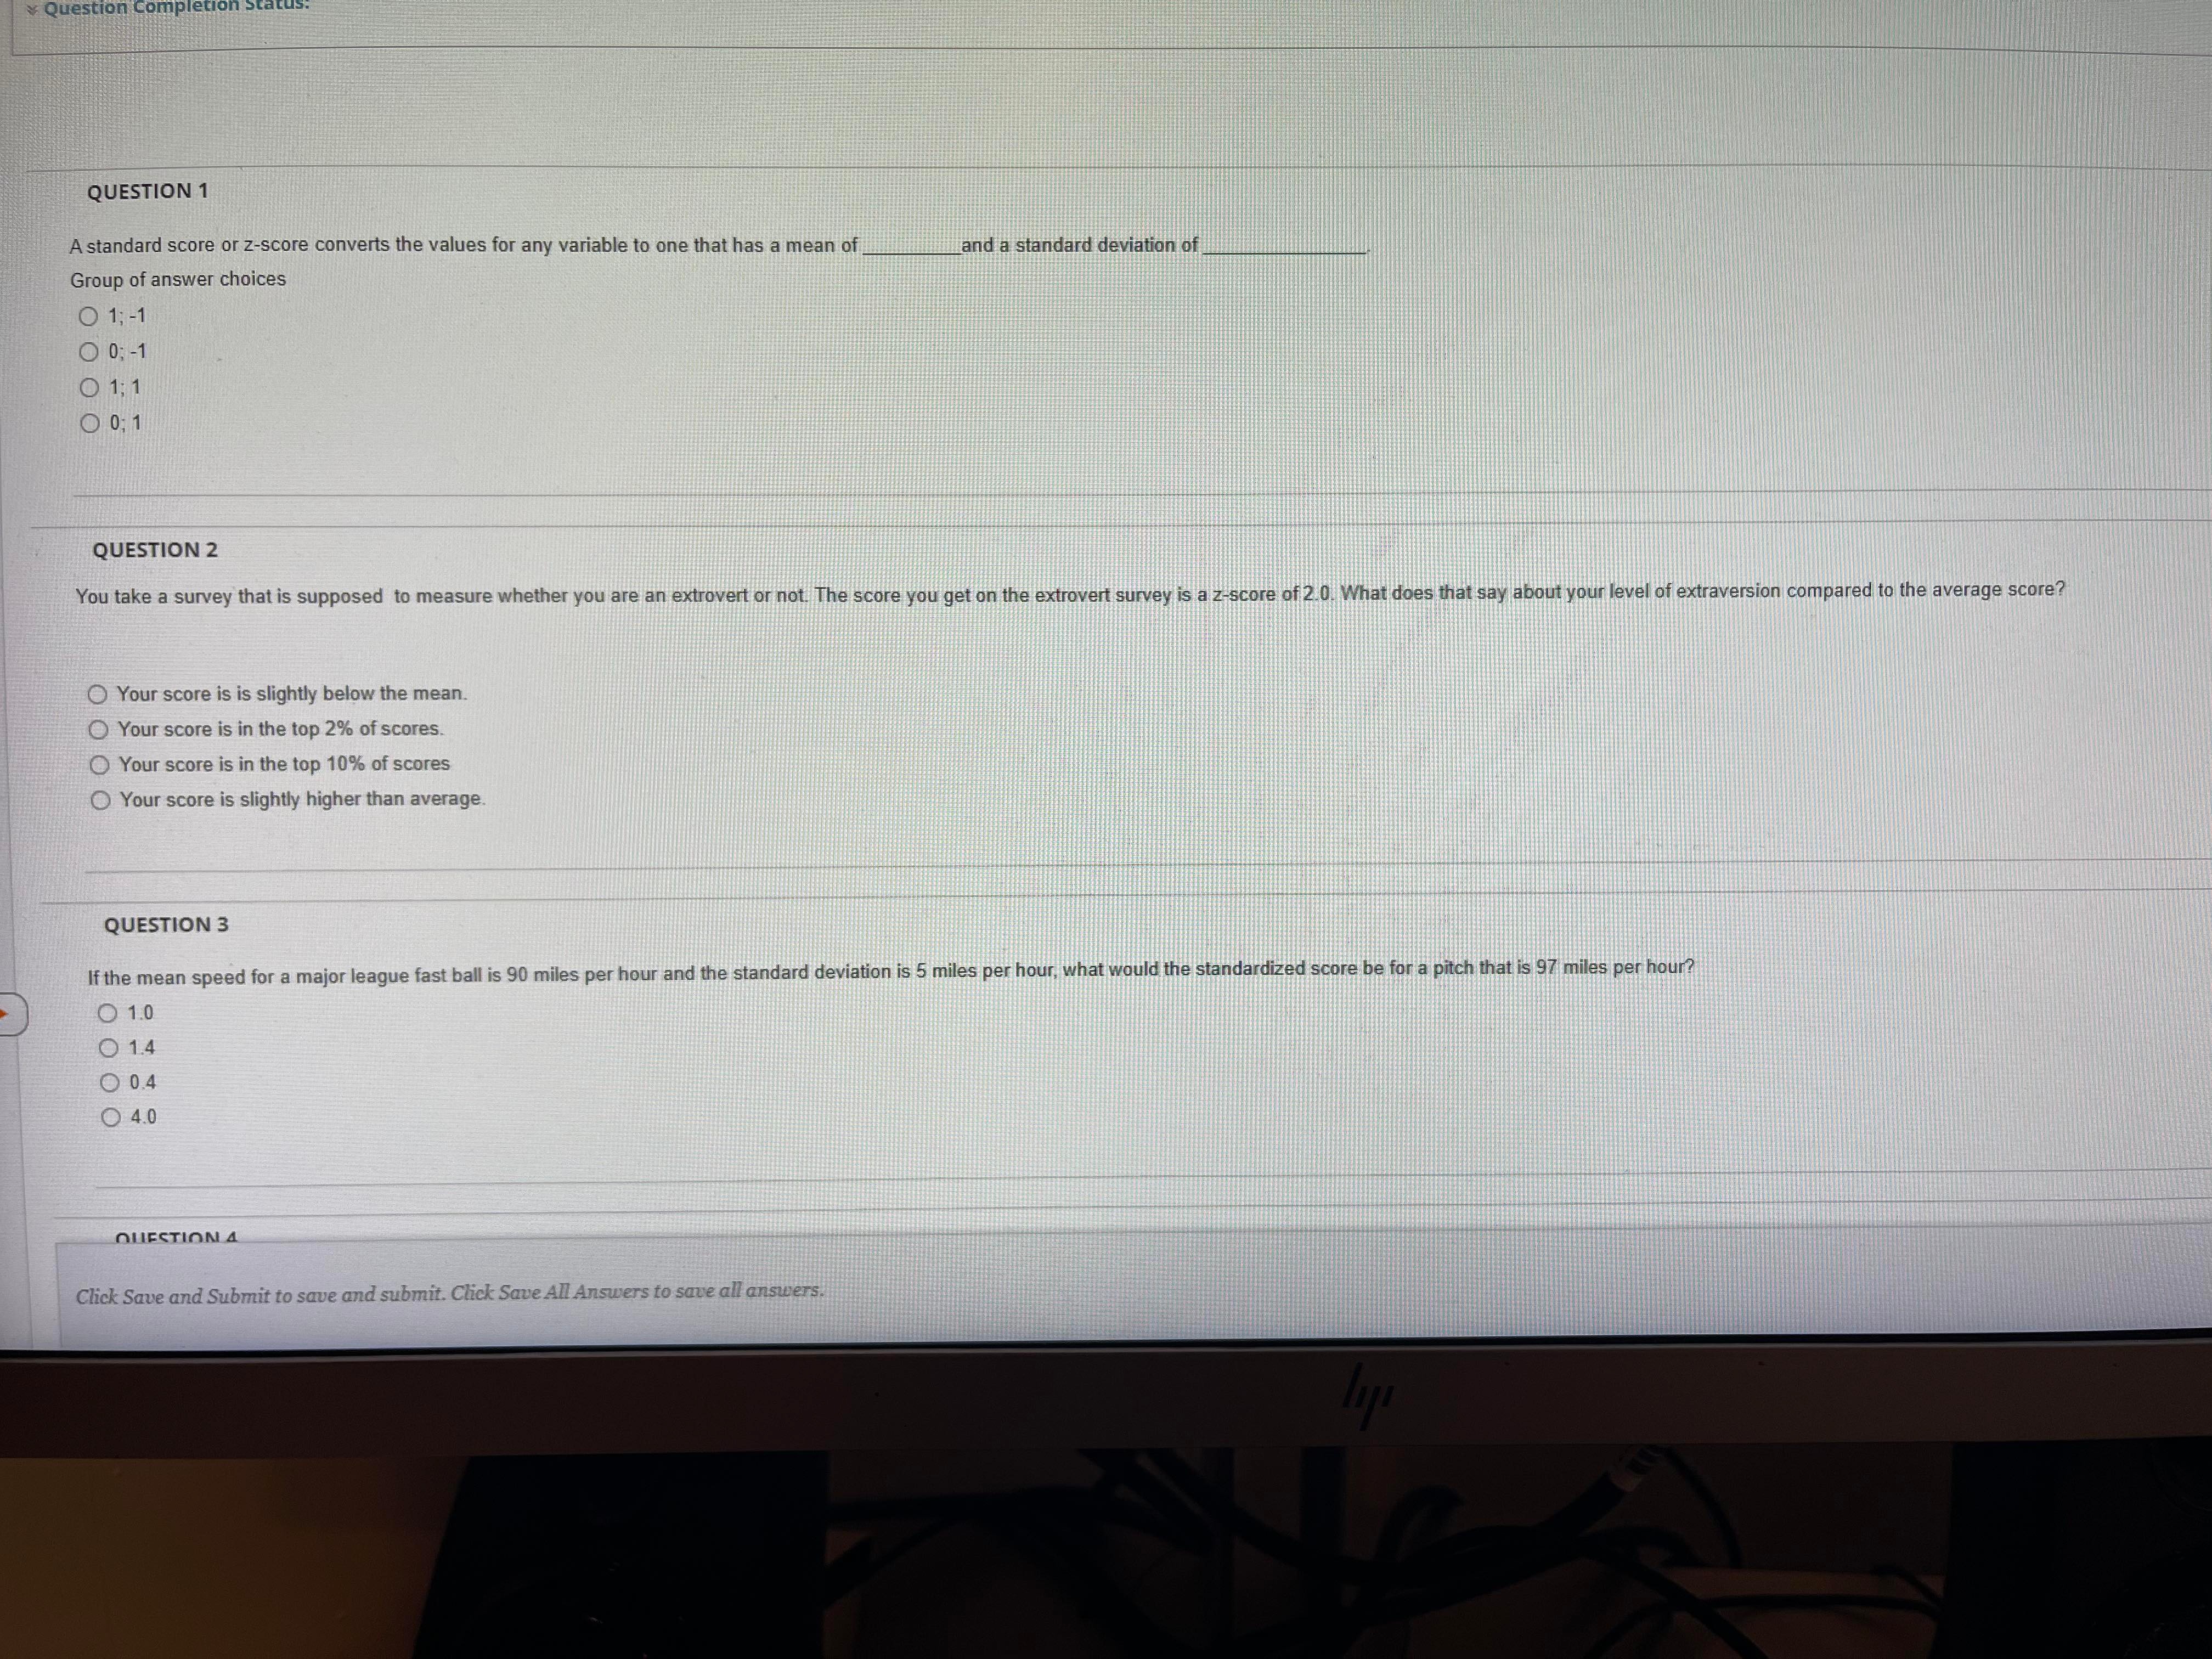
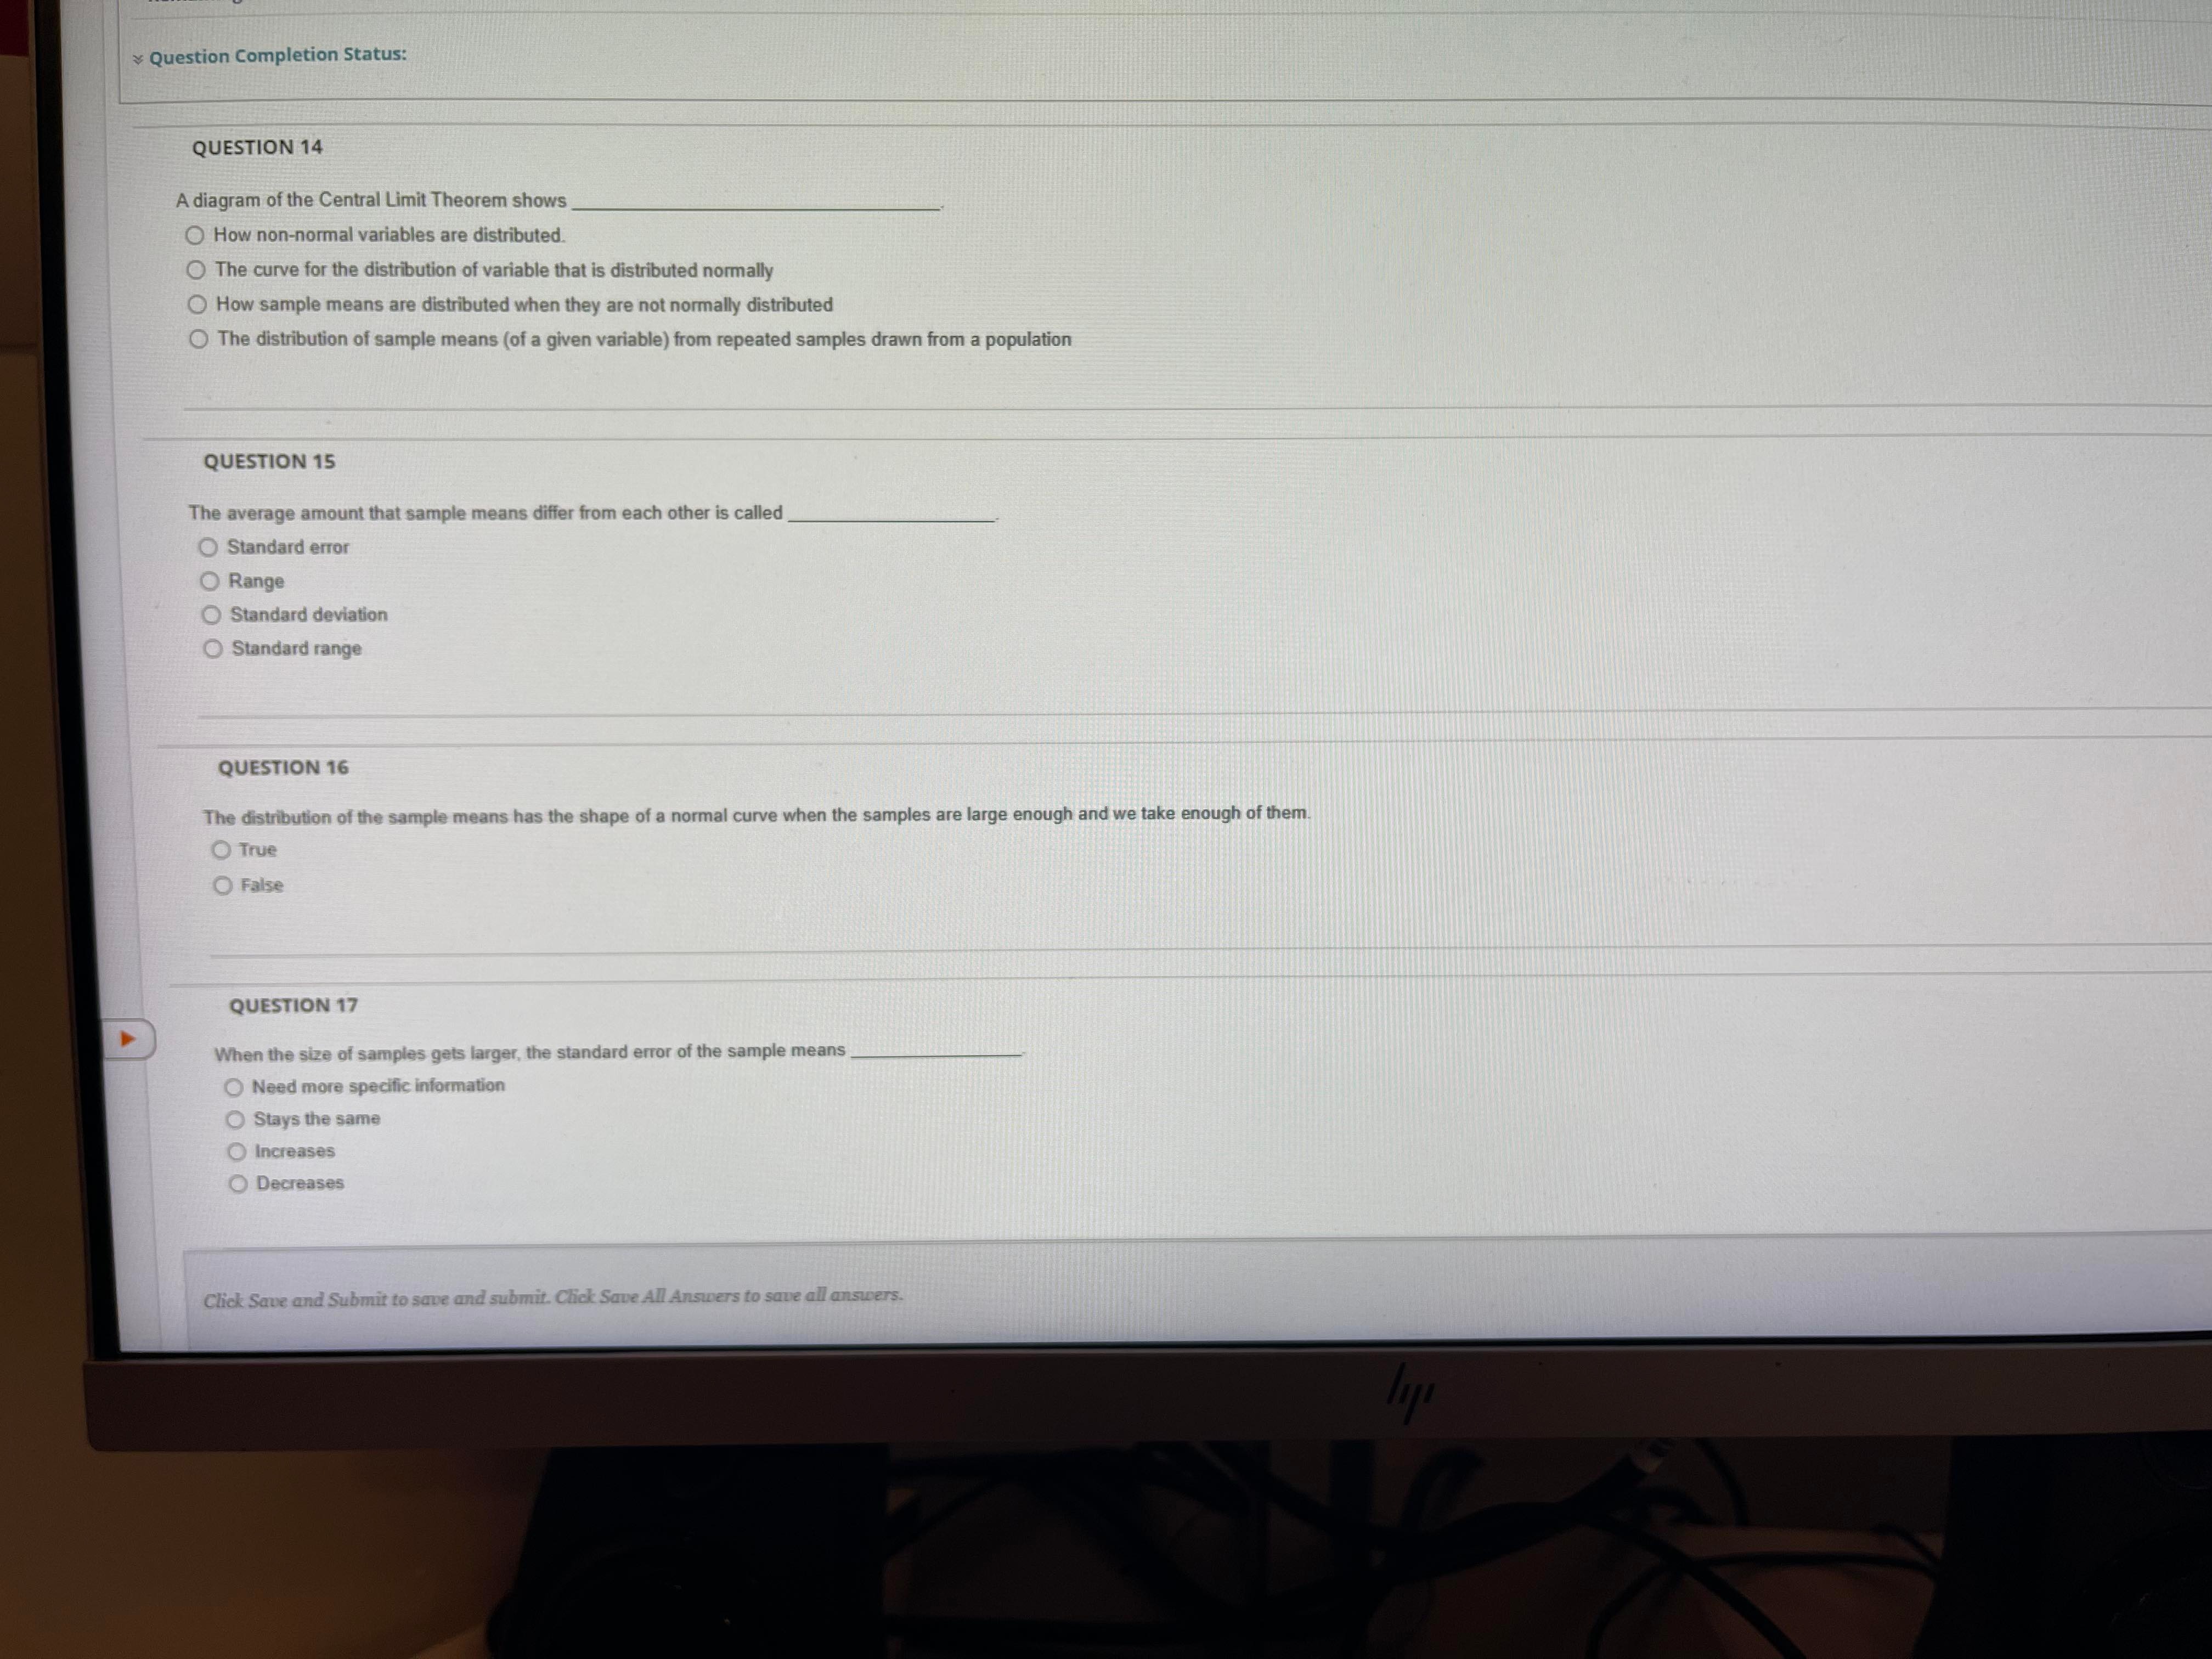
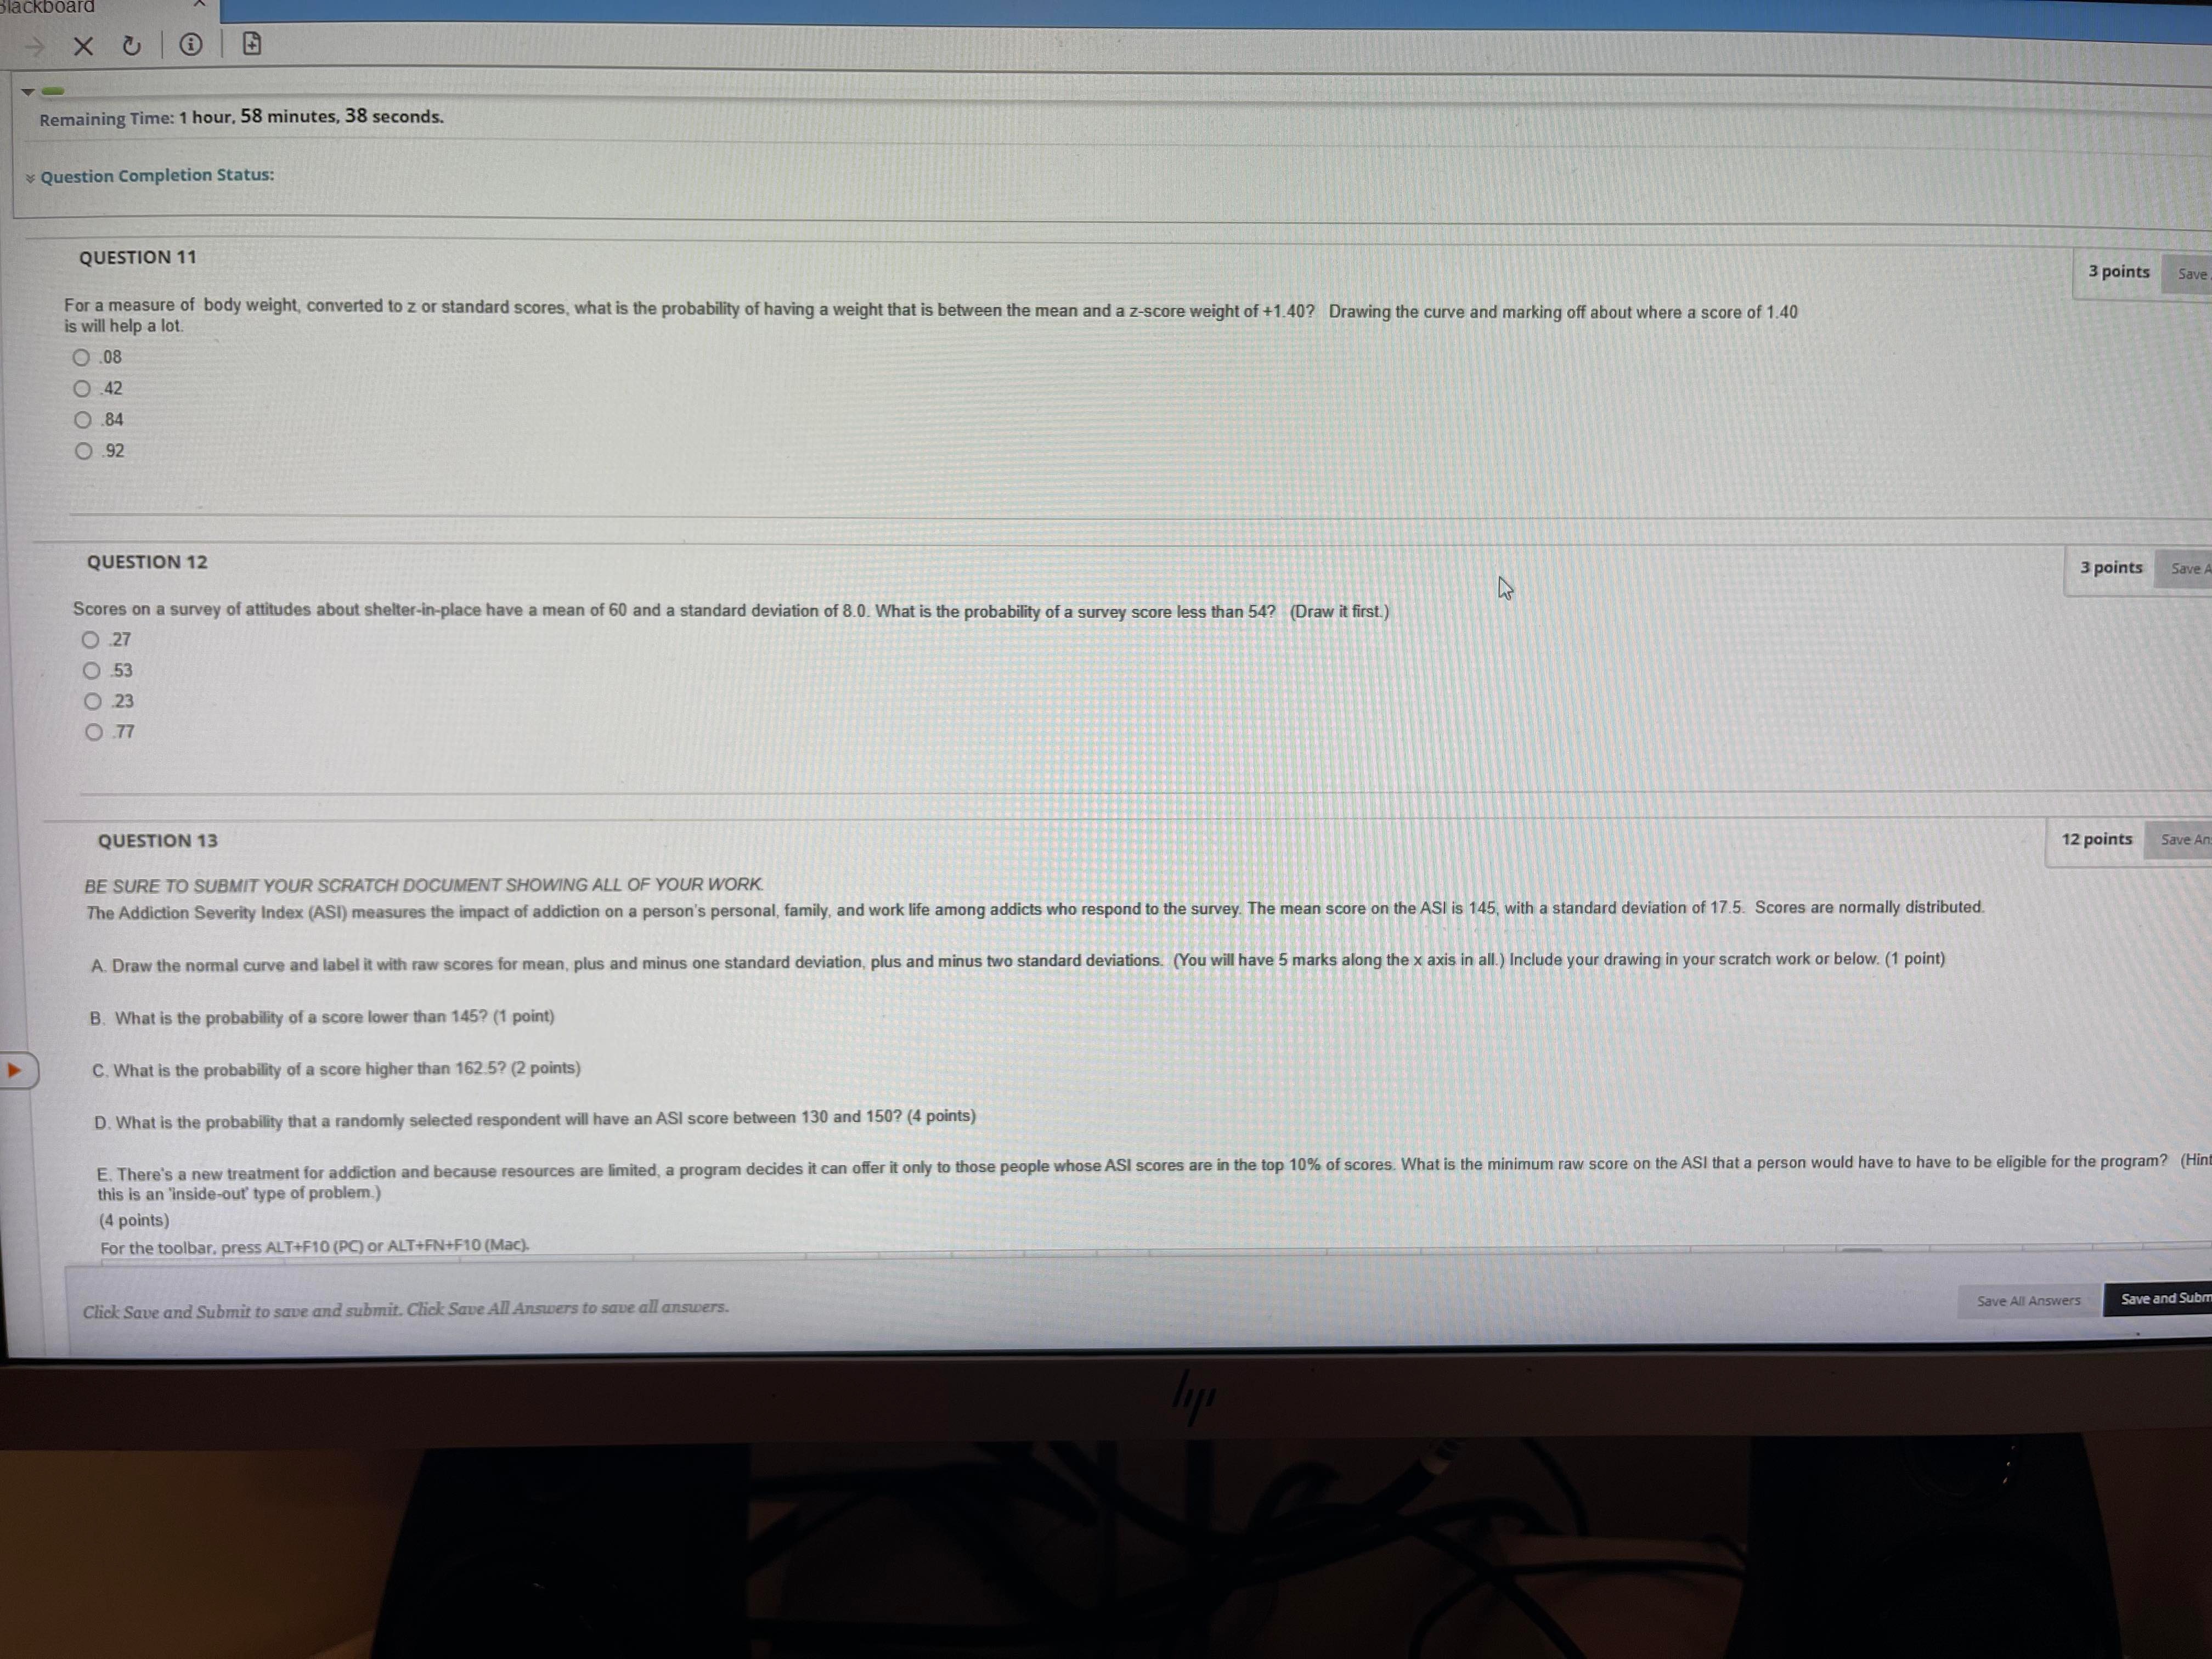
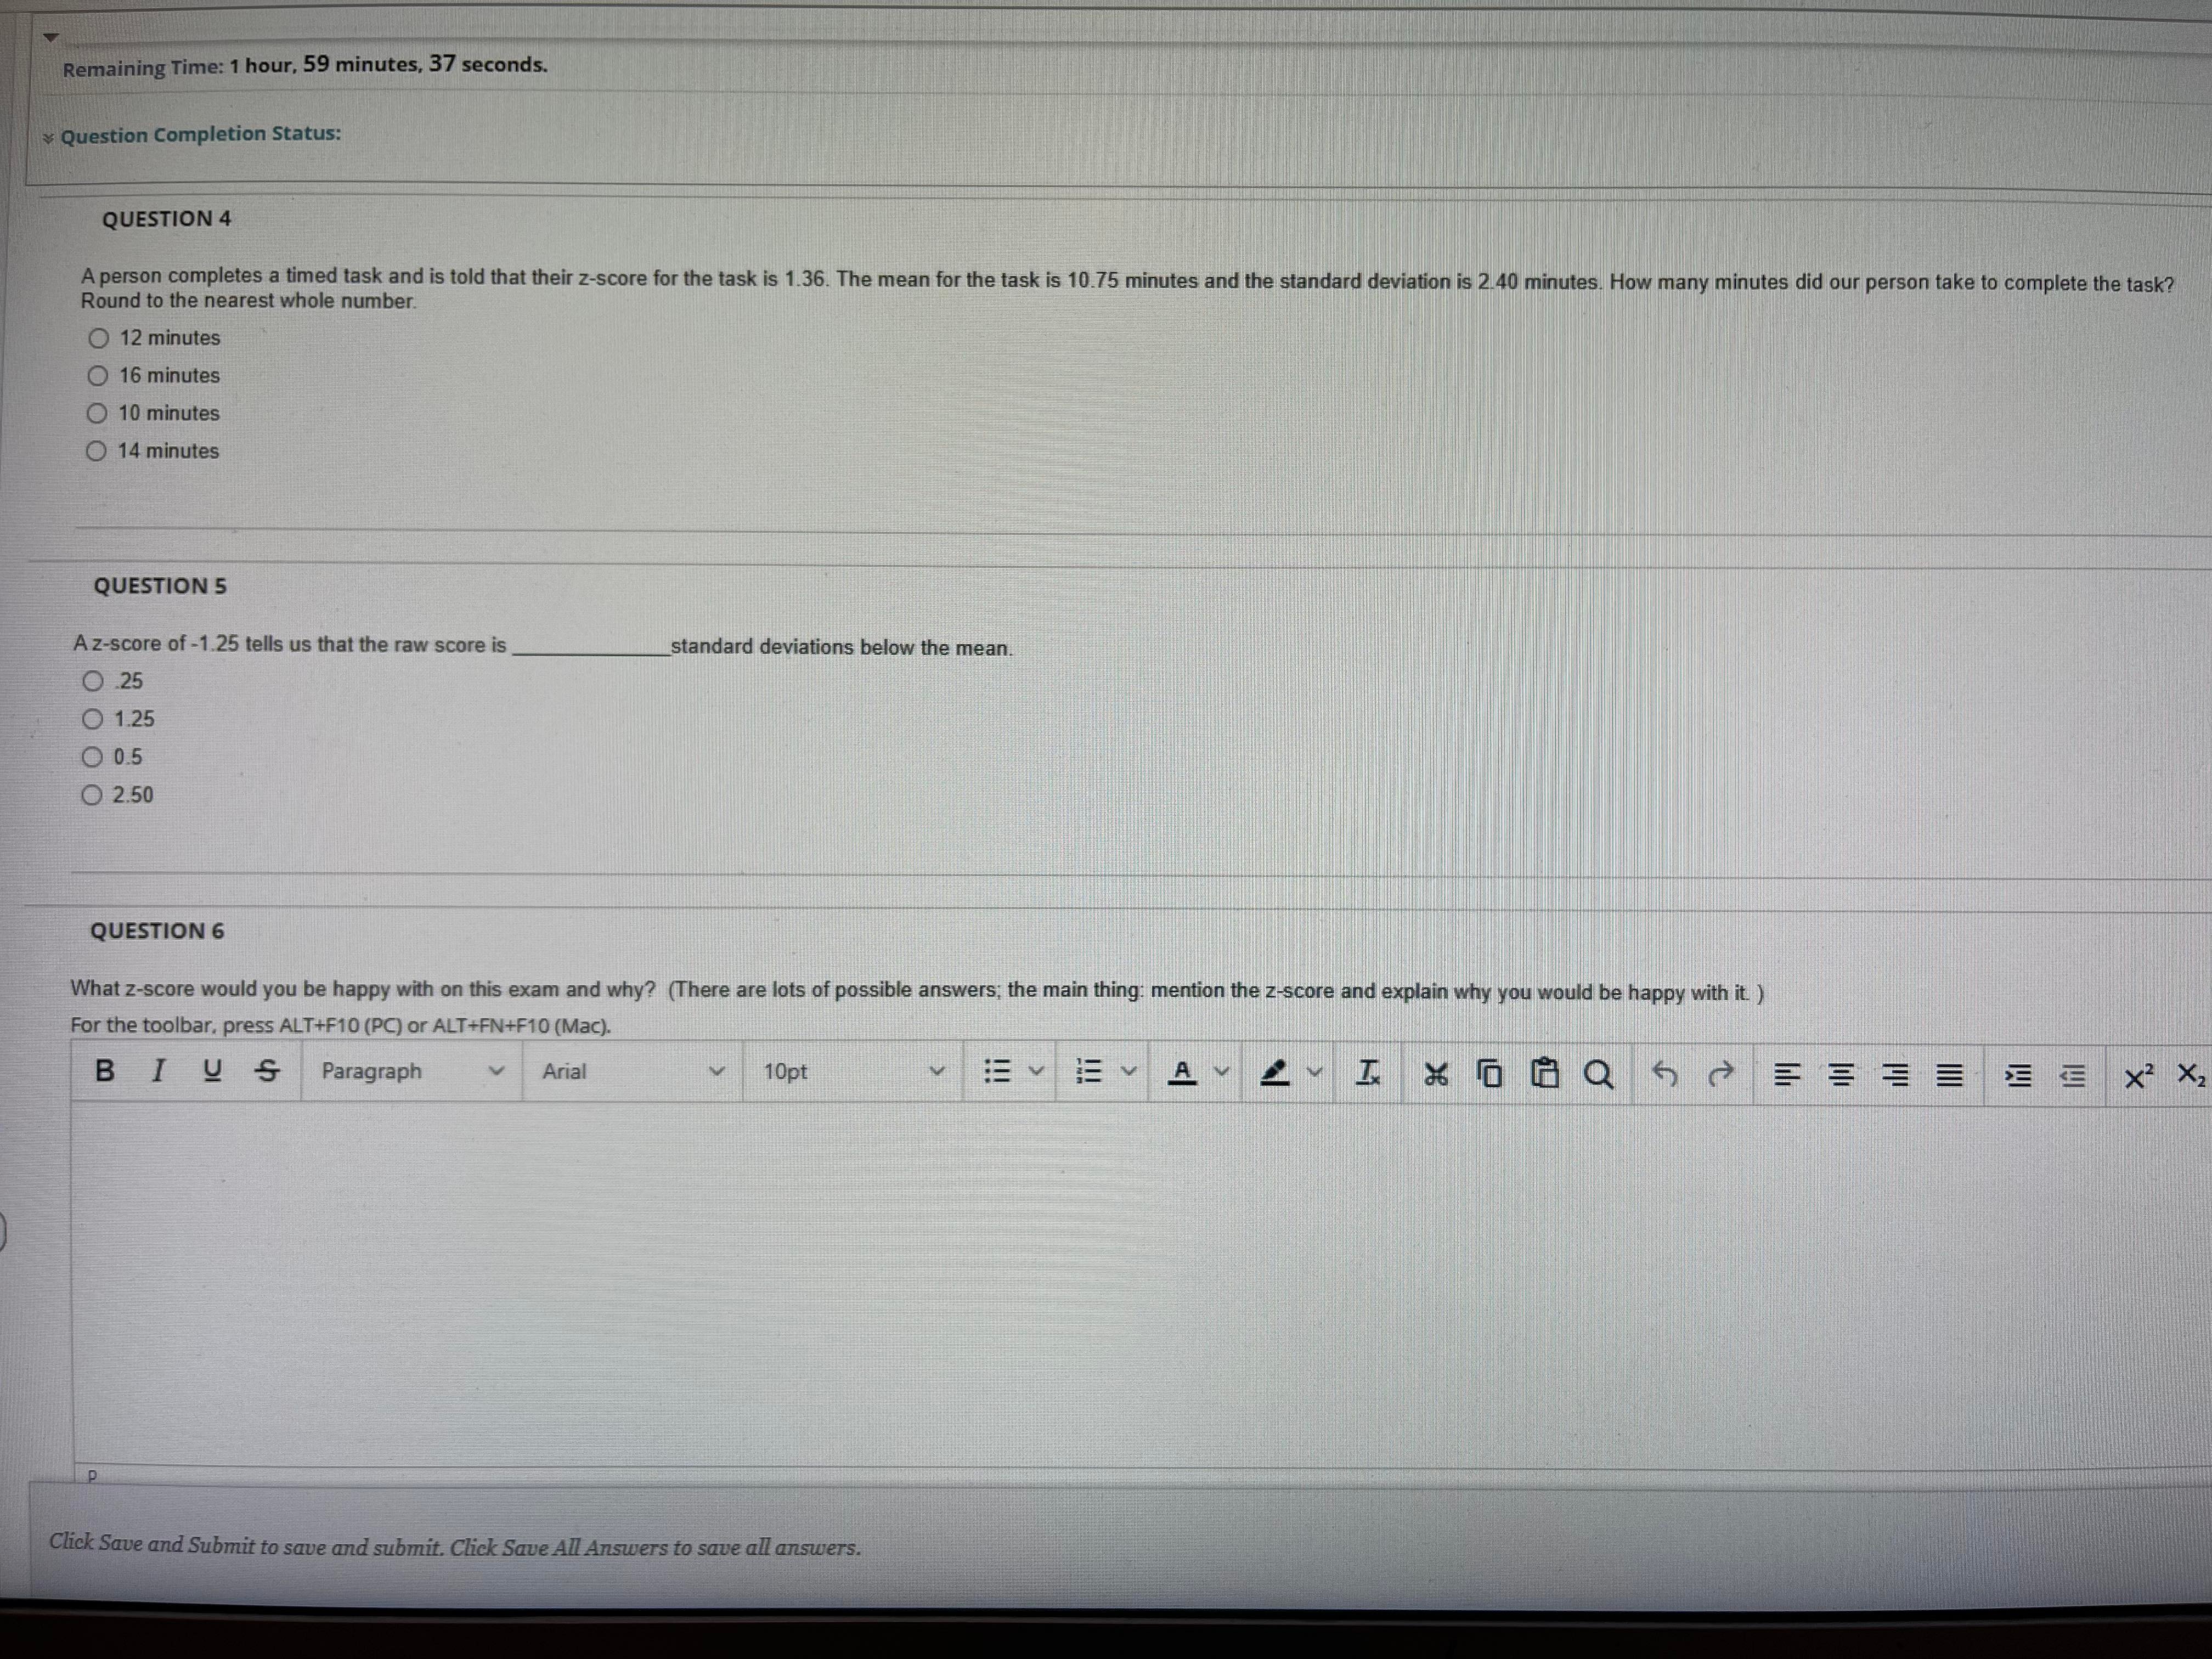
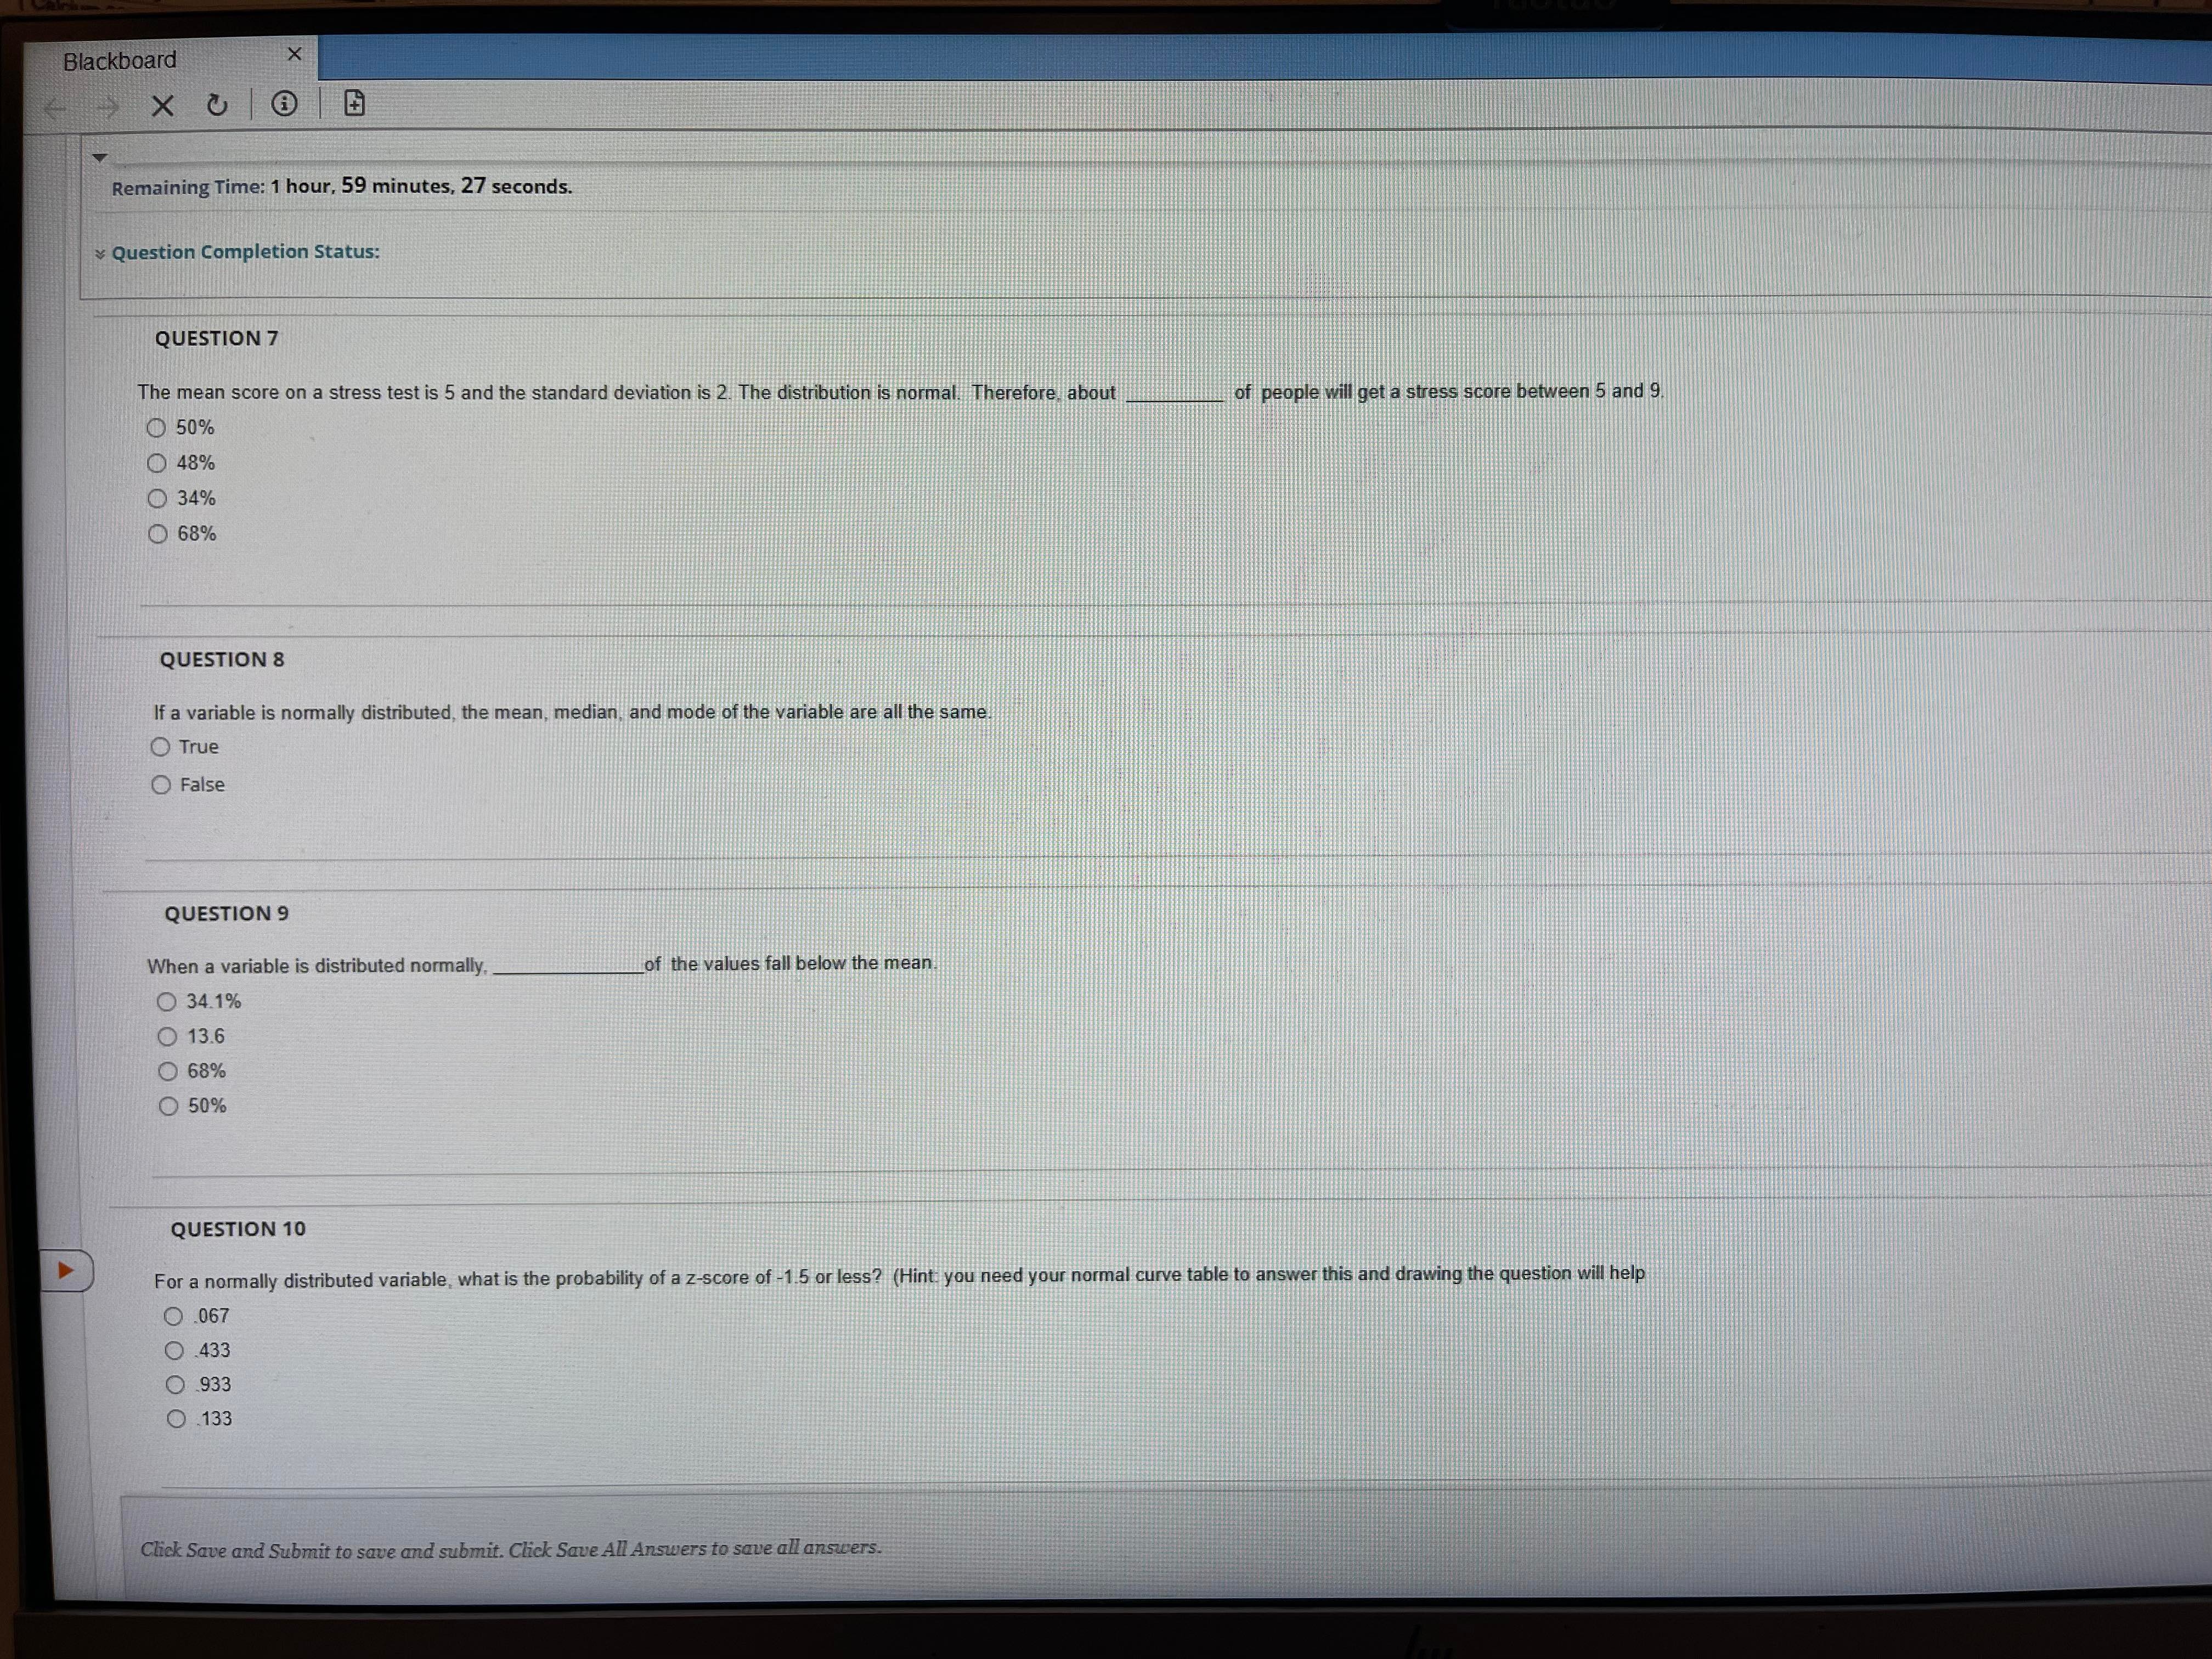
Question Completion Status: QUESTION 14 A diagram of the Central Limit Theorem shows How non-normal variables are distributed. The curve for the distribution of variable that is distributed normally How sample means are distributed when they are not normally distributed The distribution of sample means (of a given variable) from repeated samples drawn from a population QUESTION 15 The average amount that sample means differ from each other is called Standard error O Range Standard deviation Standard range QUESTION 16 The distribution of the sample means has the shape of a normal curve when the samples are large enough and we take enough of them. True O False QUESTION 17 When the size of samples gets larger, the standard error of the sample means Need more specific information O Stays the same Increases Decreases Click Save and Submit to save and submit. Click Save All Answers to save all answers.X U 1 0 Remaining Time: 1 hour, 58 minutes, 38 seconds. Question Completion Status: QUESTION 11 3 points Save is will help a lot. For a measure of body weight, converted to z or standard scores, what is the probability of having a weight that is between the mean and a z-score weight of +1.40? Drawing the curve and marking off about where a score of 1.40 O .08 O .42 O .84 O.92 QUESTION 12 points Save Scores on a survey of attitudes about shelter-in-place have a mean of 60 and a standard deviation of 8.0. What is the probability of a survey score less than 54? (Draw it first.) O .27 O.53 O.23 0 .77 QUESTION 13 12 points Save A BE SURE TO SUBMIT YOUR SCRATCH DOCUMENT SHOWING ALL OF YOUR WORK. The Addiction Severity Index (ASI) measures the impact of addiction on a person's personal, family, and work life among addicts who res core on the ASI is 145, with a standard deviation of 17.5. Scores are normally distributed. A. Draw the normal curve and label it with raw scores for mean, plus and minus one standard deviation, plus and minus two standard deviations. (You will have 5 marks a Include your drawing in your scratch work or below. (1 point) B. What is the probability of a score lower than 145? (1 point) C. What is the probability of a score higher than 162.5? (2 points) D. What is the probability that a randomly selected respondent will have an ASI score between 130 and 150? (4 points) E. There's a new treatment for addiction and because resources are limited, a program decides it can offer it only to those people whose ASI scores are in the top 10% of scores. What is the minimum raw score on the ASI that a person would have to have to be eligible for the program? (Hir this is an 'inside-out' type of problem.) (4 points) For the toolbar, press ALT+F10 (PC) or ALT+FN+F10 (Mac). Click Save and Submit to save and submit. Click Save All Answers to save all answers. Save All Answers Save and SubRemaining Time: 1 hour, 59 minutes, 37 seconds. Question Completion Status: QUESTION 4 A person completes a timed task and is told that their z-score for the task is 1.36. The mean for the task is 10.75 minutes and the standard deviation is 2 40 minutes. How many minutes did our person take to complete the task? Round to the nearest whole number. O 12 minutes 16 minutes 10 minutes 14 minutes QUESTION 5 A z-score of -1.25 tells us that the raw score is standard deviations below the mean O .25 O 1.25 O 0.5 O 2.50 QUESTION 6 What z-score would you be happy with on this exam and why? (There are lots of possible answers; the main thing: mention the z-score and explain why you would be happy with it. ) For the toolbar, press ALT+F10 (PC) or ALT+FN+F10 (Mac). BIUS Paragraph Arial 10pt X2 X 2 Click Save and Submit to save and submit. Click Save All Answers to save all answers.Blackboard X X U @ G Remaining Time: 1 hour, 59 minutes, 27 seconds. Question Completion Status: QUESTION 7 The mean score on a stress test is 5 and the standard deviation is 2. The distribution is normal. Therefore about of people will get a stress score between 5 and 9 50% O 48% 34% 68% QUESTION 8 If a variable is normally distributed, the mean, median, and mode of the variable are all the same True O False QUESTION 9 When a variable is distributed normally, of the values fall below the mean. 34.1% 13.6 68% O 50% QUESTION 10 For a normally distributed variable, what is the probability of a z-score of -1.5 or less? (Hint you need your normal curve table to answer this and drawing the question will help O .067 O .433 O .933 O .133 Click Save and Submit to save and submit. Click Save All Answers to save all answers.Question Co QUESTION 1 A standard score or z-score converts the values for any variable to one that has a mean of and a standard deviation of Group of answer choices 0 1; -1 0 0; -1 0 1; 1 0 0; 1 QUESTION 2 You take a survey that is supposed to measure whether you are an extrovert or not. The score you get on the extrovert survey is a z-score of 2.0. What does that say about your level of extraversion compared to the average score? Your score is is slightly below the mean. Your score is in the top 2% of scores. Your score is in the top 10% of scores Your score is slightly higher than average. QUESTION 3 If the mean speed for a major league fast ball is 90 miles per hour and the standard deviation is 5 miles per hour, what would the standardized score be for a pitch that is 97 miles per hour? O 10 O 1.4 0 0.4 40 QUESTION A Click Save and Submit to save and submit. Click Save All Answers to save all answers
Step by Step Solution
There are 3 Steps involved in it

Get step-by-step solutions from verified subject matter experts