

Question: How do I draw a relative frequency and histogram for this chart? Table 1.2 The States that voted the Republic Party 1) State 2) Income,
How do I draw a relative frequency and histogram for this chart?
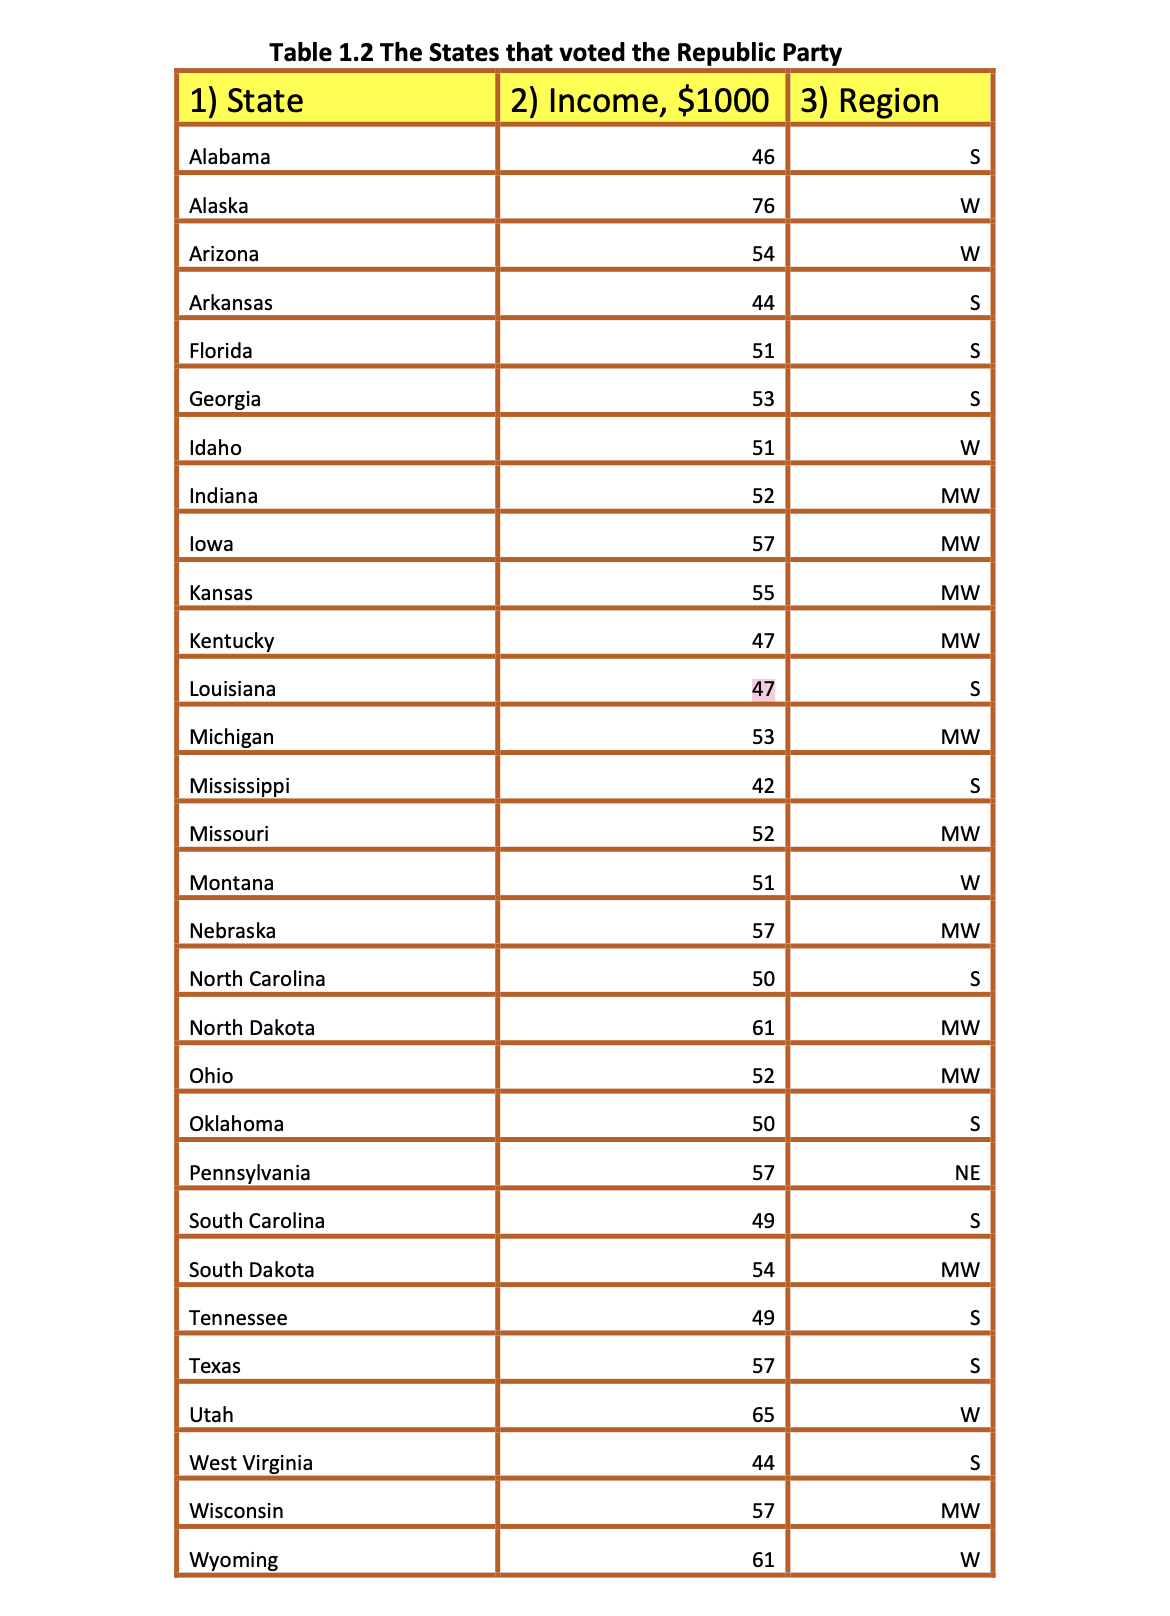
Table 1.2 The States that voted the Republic Party 1) State 2) Income, $1000 3) Region 46 S Alabama 76 W Alaska 54 W Arizona 44 S Arkansas 51 S Florida 53 S Georgia Idaho 51 W 52 MW Indiana 57 MW lowa 55 MW Kansas 47 MW Kentucky 47 S Louisiana 53 MW Michigan 42 S Mississippi MW Missouri 52 Montana 51 W 57 MW Nebraska North Carolina 50 S 61 MW North Dakota 52 MW Ohio 50 S Oklahoma Pennsylvania 57 NE S South Carolina 49 54 MW South Dakota 49 S Tennessee 57 S Texas W Utah 65 44 S West Virginia Wisconsin 57 MW 61 W Wyoming
Step by Step Solution
There are 3 Steps involved in it
1 Expert Approved Answer
Step: 1 Unlock

Question Has Been Solved by an Expert!
Get step-by-step solutions from verified subject matter experts
Step: 2 Unlock
Step: 3 Unlock