

Question: 17. on graph paper, construct by hand two boxplots on the same number line so as to compare the household income for different voters. 19.
17. on graph paper, construct by hand two boxplots on the same number line so as to compare the household income for different voters.
19. compare the boxplots and commend on the economic differences between the states that voted for Republic and Democratic parties
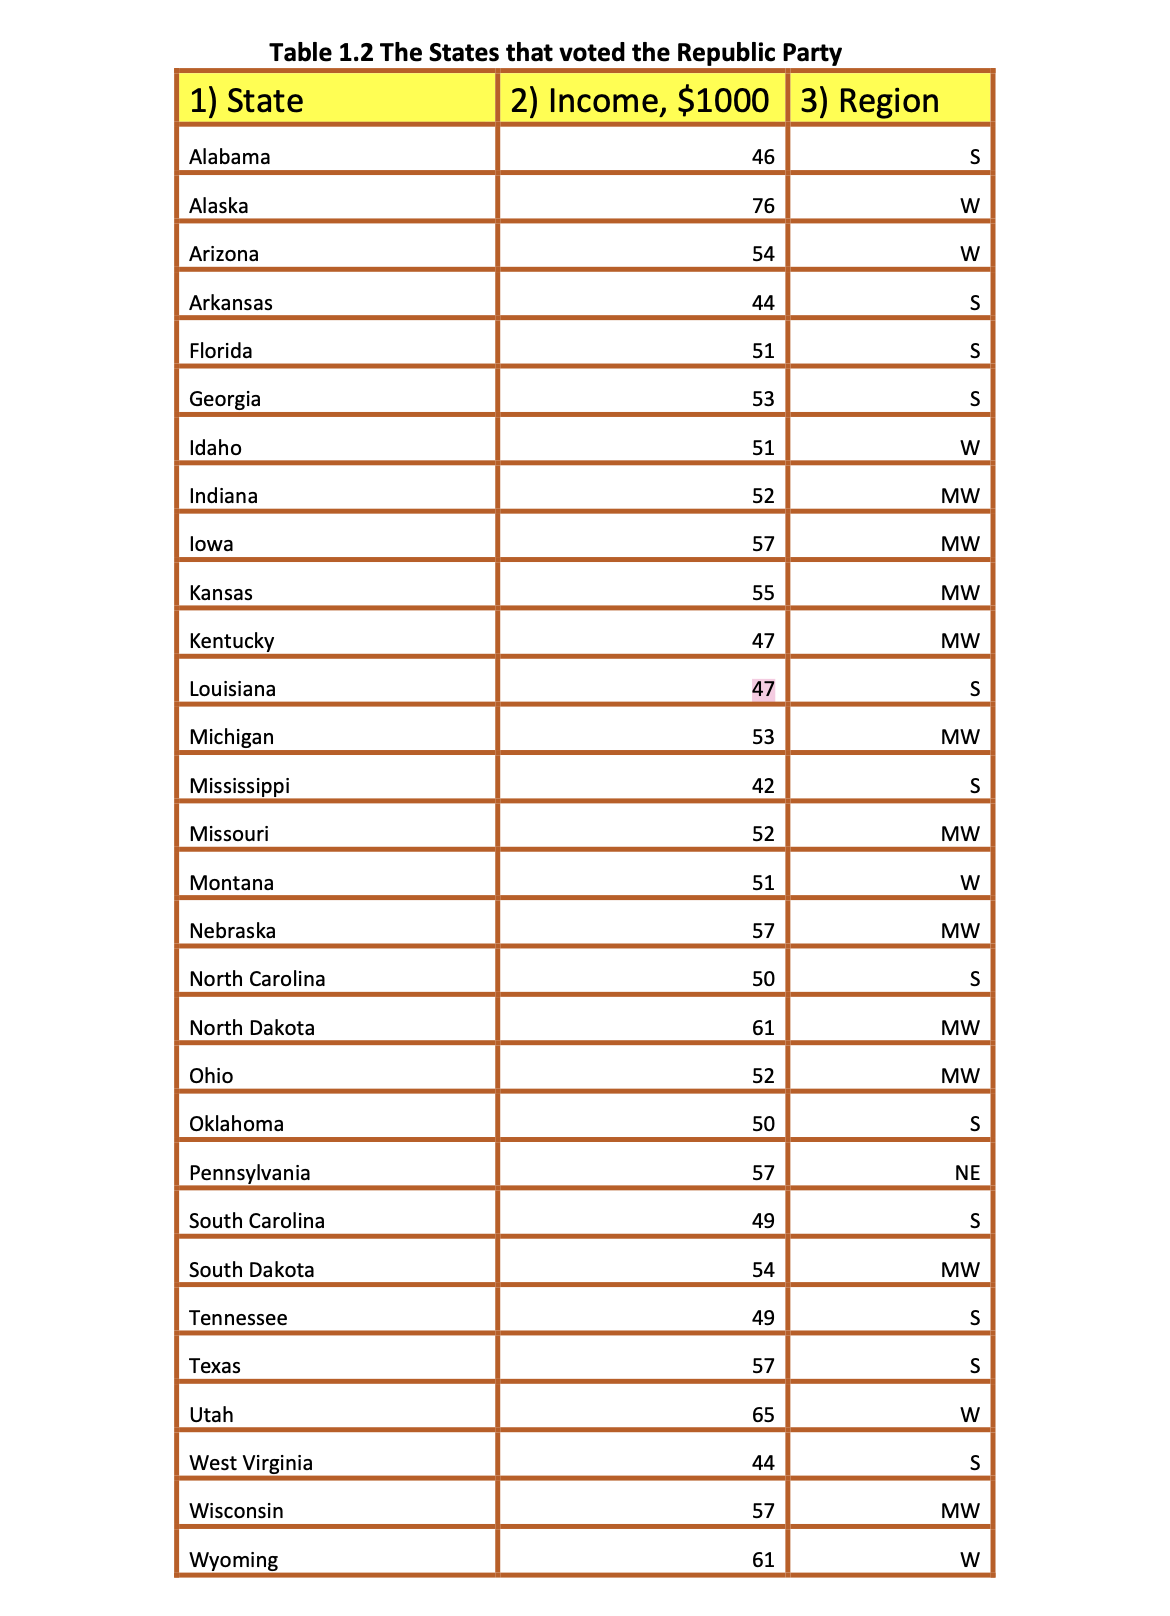
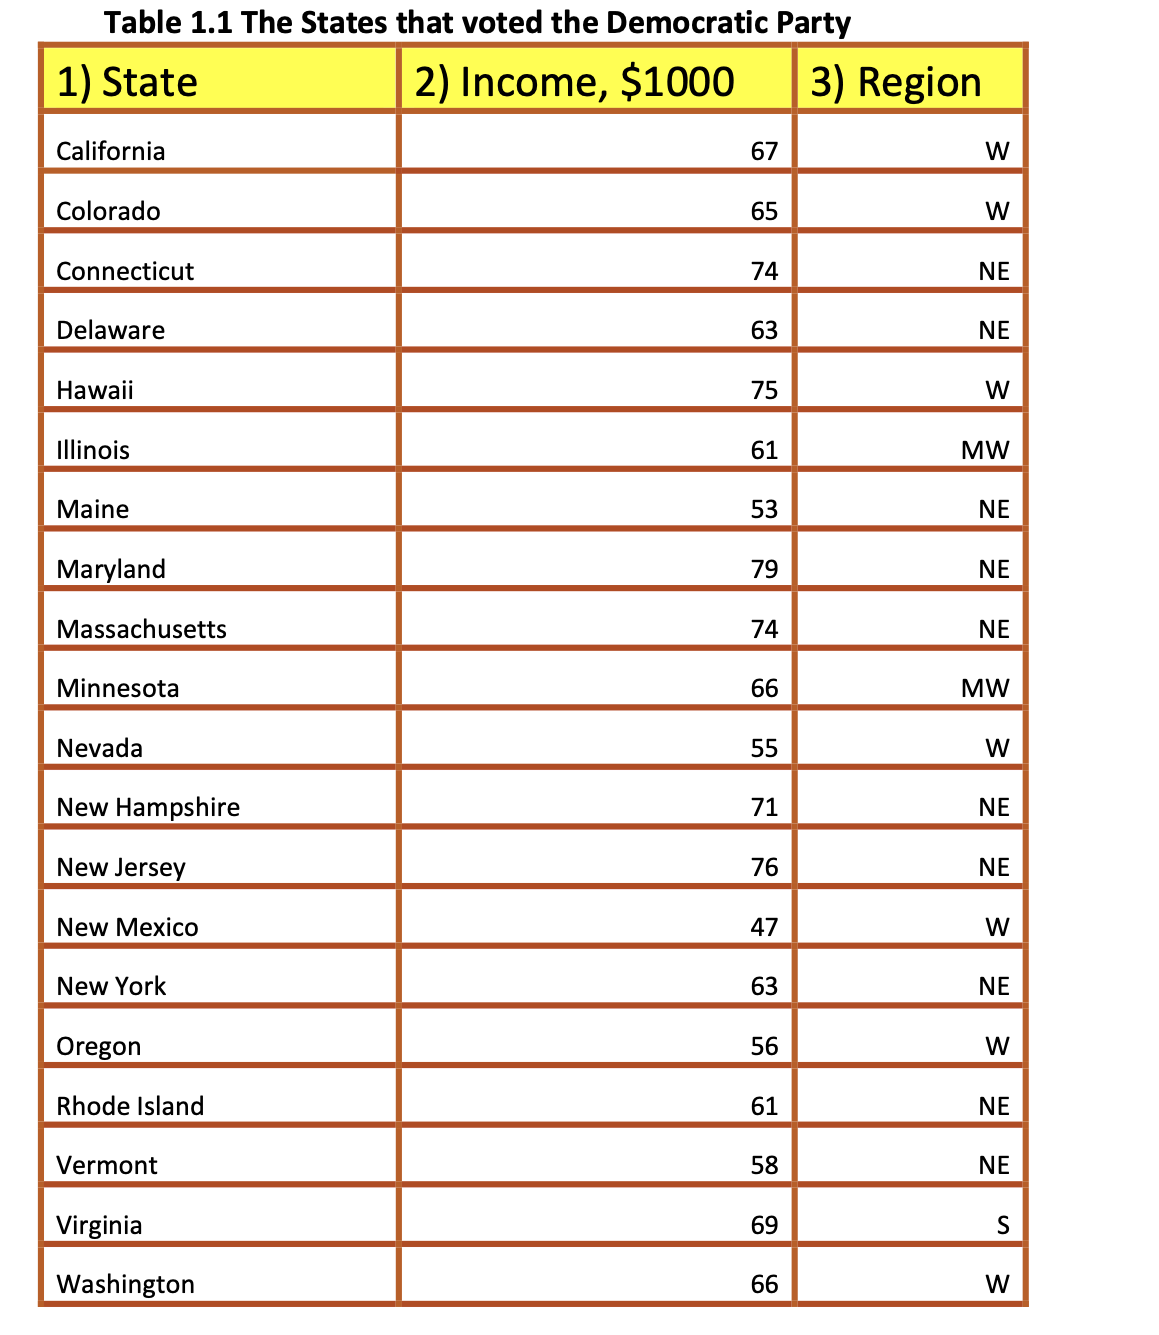
Table 1.2 The States that voted the Republic Party 1) State 2) Income, $1000 3) Region 46 S Alabama 76 W Alaska 54 W Arizona 44 S Arkansas 51 S Florida 53 S Georgia Idaho 51 W 52 MW Indiana 57 MW lowa 55 MW Kansas 47 MW Kentucky 47 S Louisiana 53 MW Michigan 42 S Mississippi MW Missouri 52 Montana 51 W 57 MW Nebraska North Carolina 50 S 61 MW North Dakota 52 MW Ohio 50 S Oklahoma Pennsylvania 57 NE S South Carolina 49 54 MW South Dakota 49 S Tennessee 57 S Texas W Utah 65 44 S West Virginia Wisconsin 57 MW 61 W WyomingTable 1.1 The States that voted the Democratic Party 1) State 2) Income, $1000 3) Region California 67 W Colorado 65 W Connecticut 74 NE Delaware 63 NE Hawaii 75 W Illinois 61 MW Maine 53 NE Maryland 79 NE Massachusetts 74 NE Minnesota 66 MW Nevada 55 W New Hampshire 71 NE New Jersey 76 NE New Mexico 47 W New York 63 NE Oregon 56 W Rhode Island 61 NE Vermont 58 NE Virginia 69 S Washington 66 W
Step by Step Solution
There are 3 Steps involved in it

Get step-by-step solutions from verified subject matter experts