

Question: How do I figure out the colored formulas and the blank spots? 125% F V View Zoom Add Category Insert Table Chart Text Shape Media

How do I figure out the colored formulas and the blank spots?
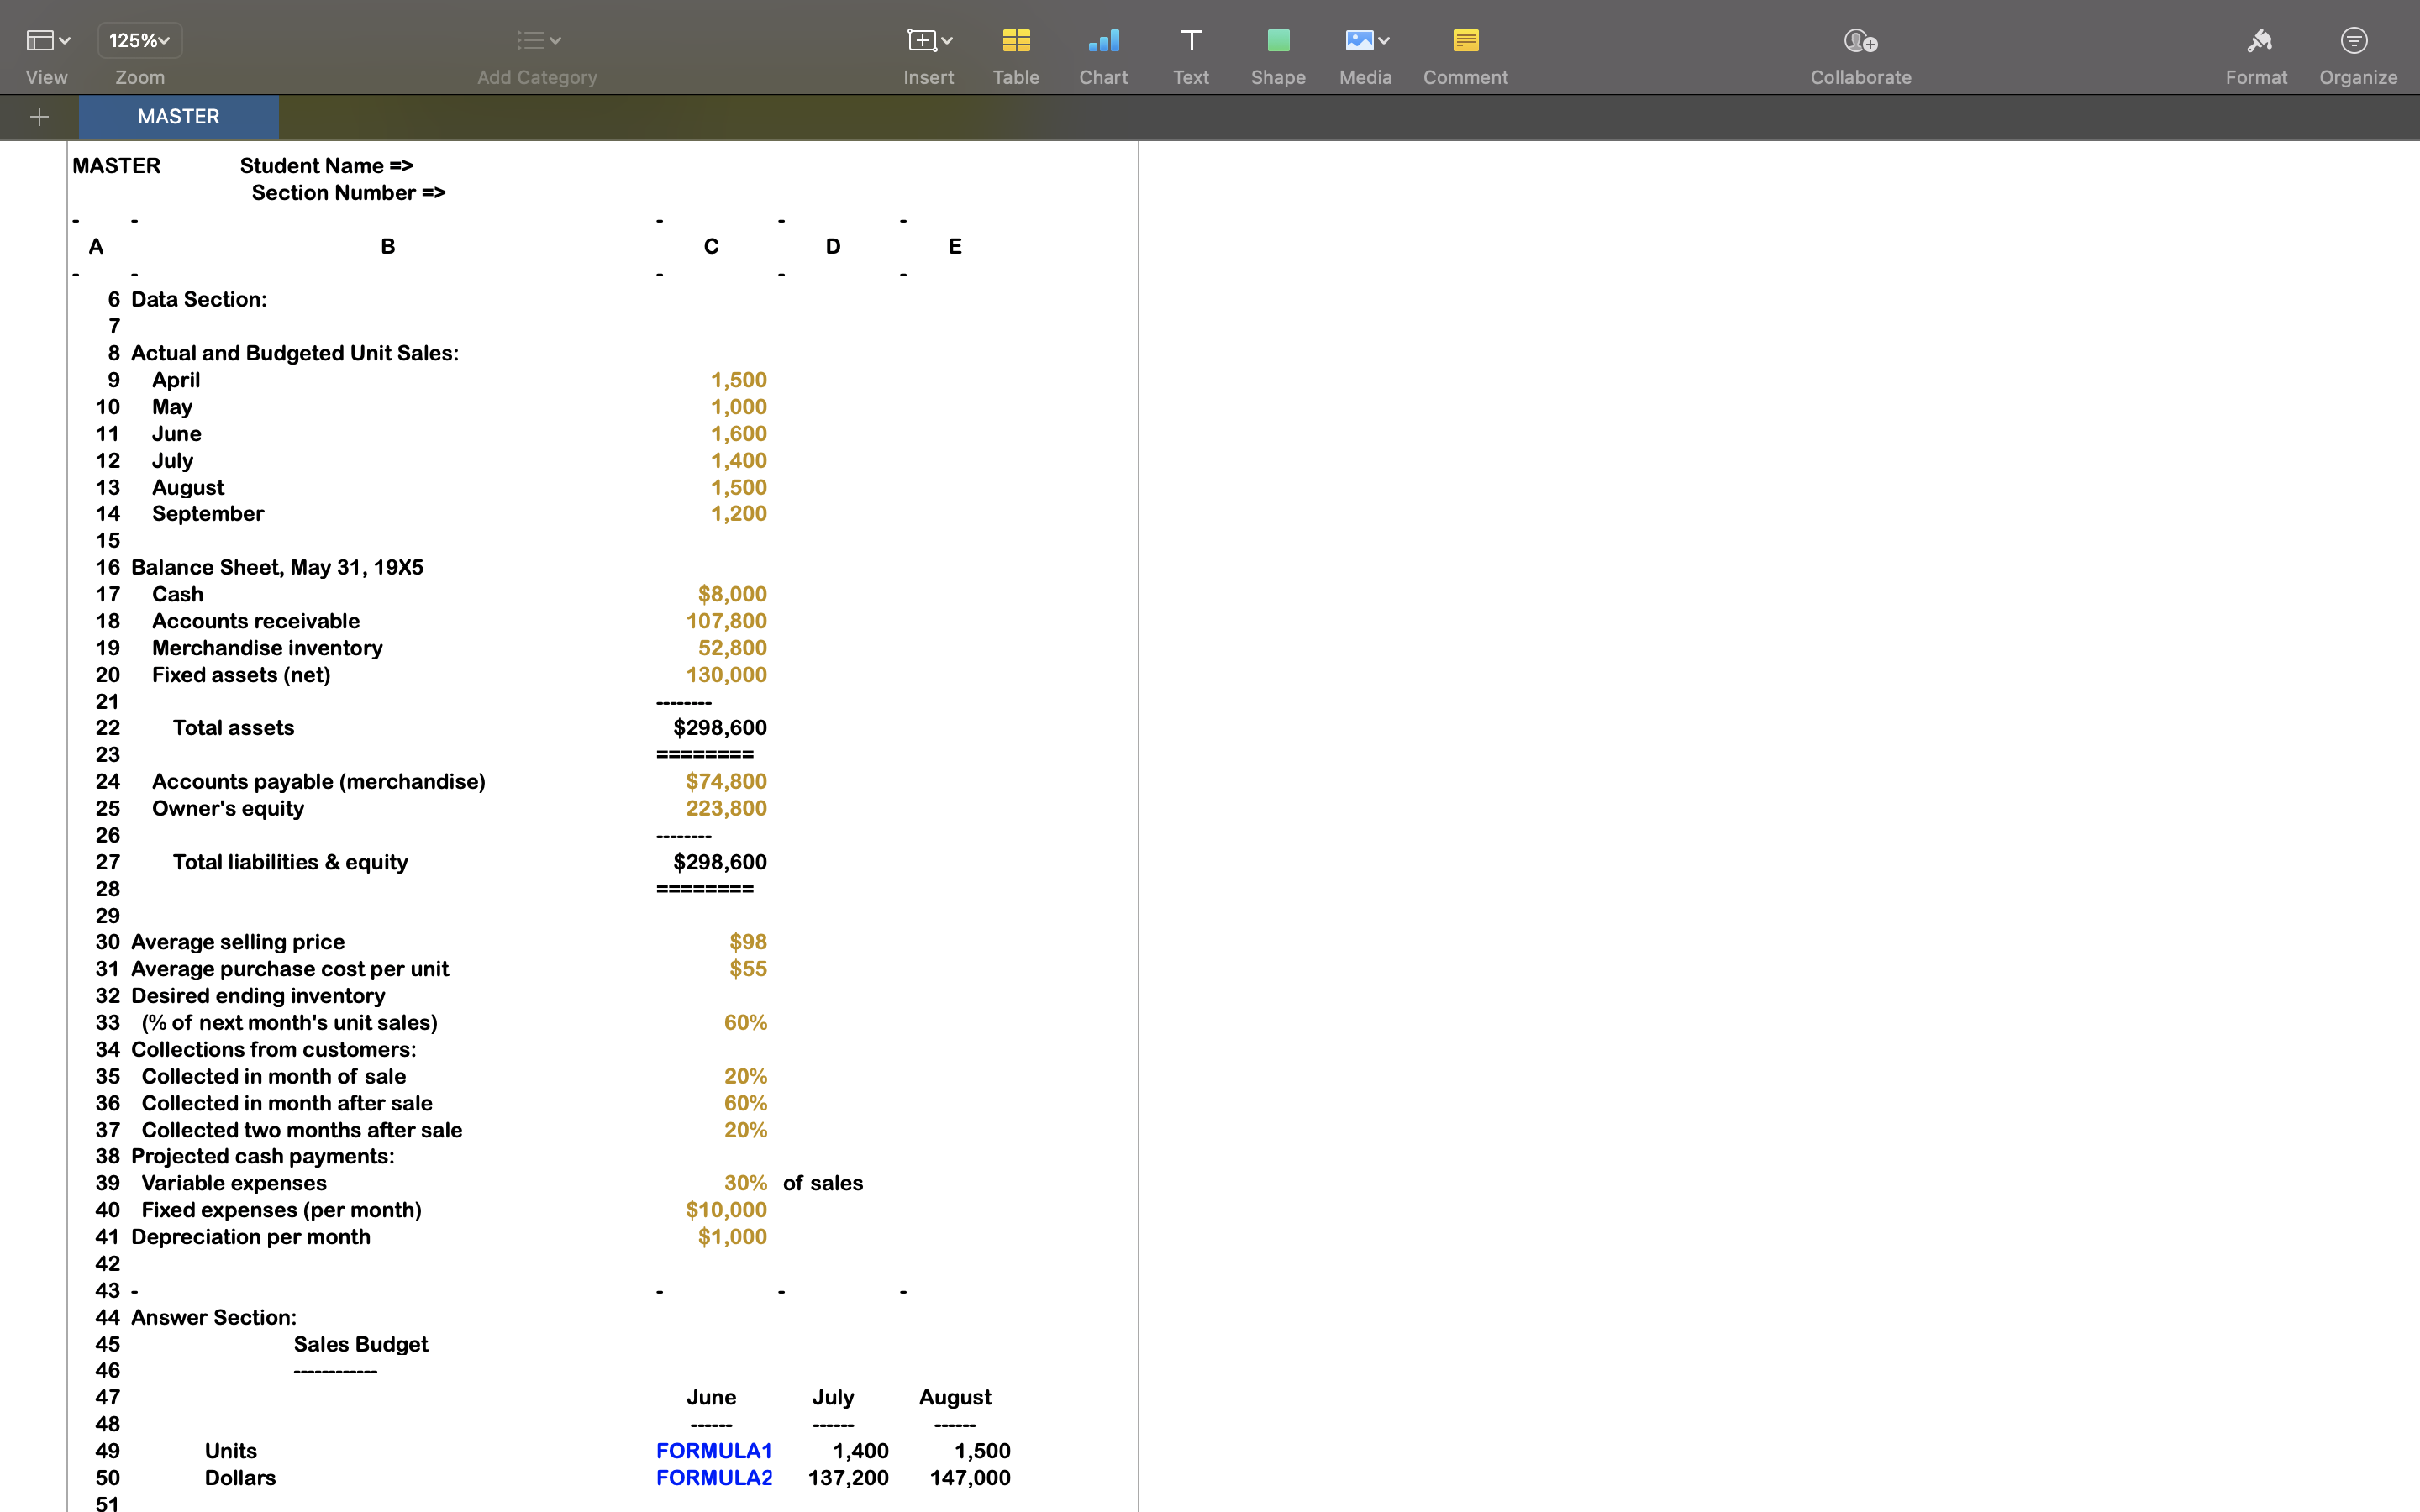

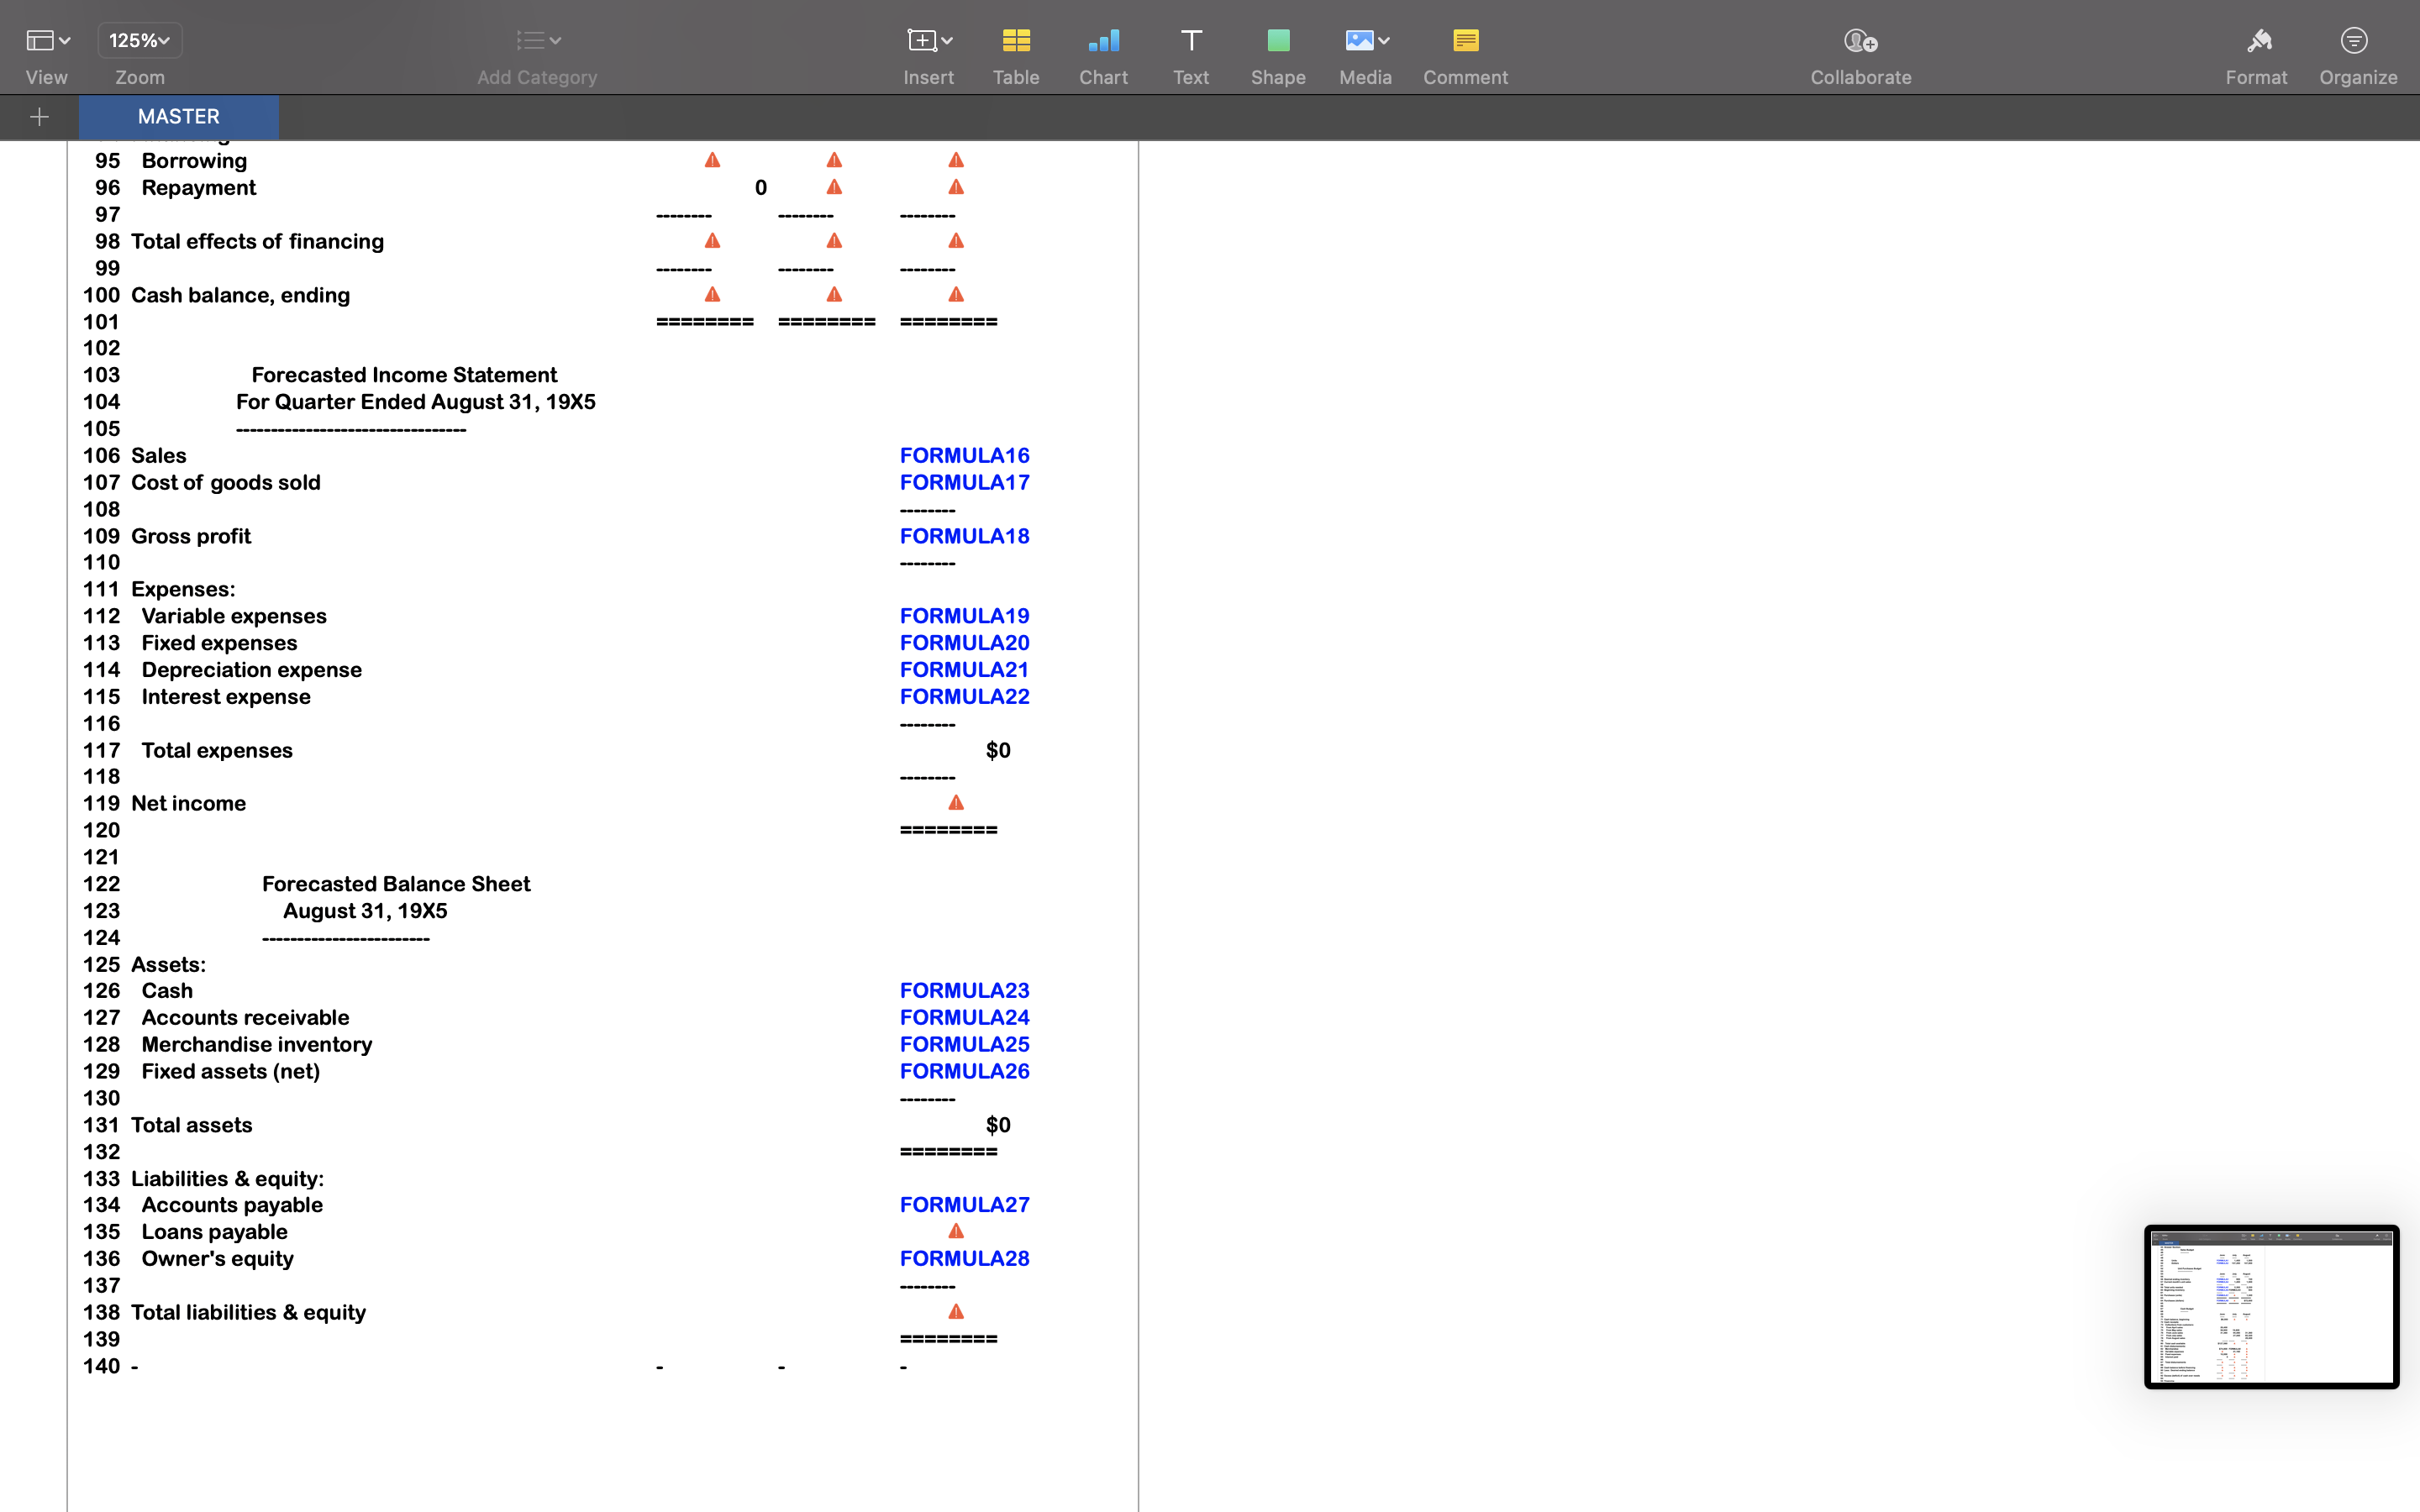
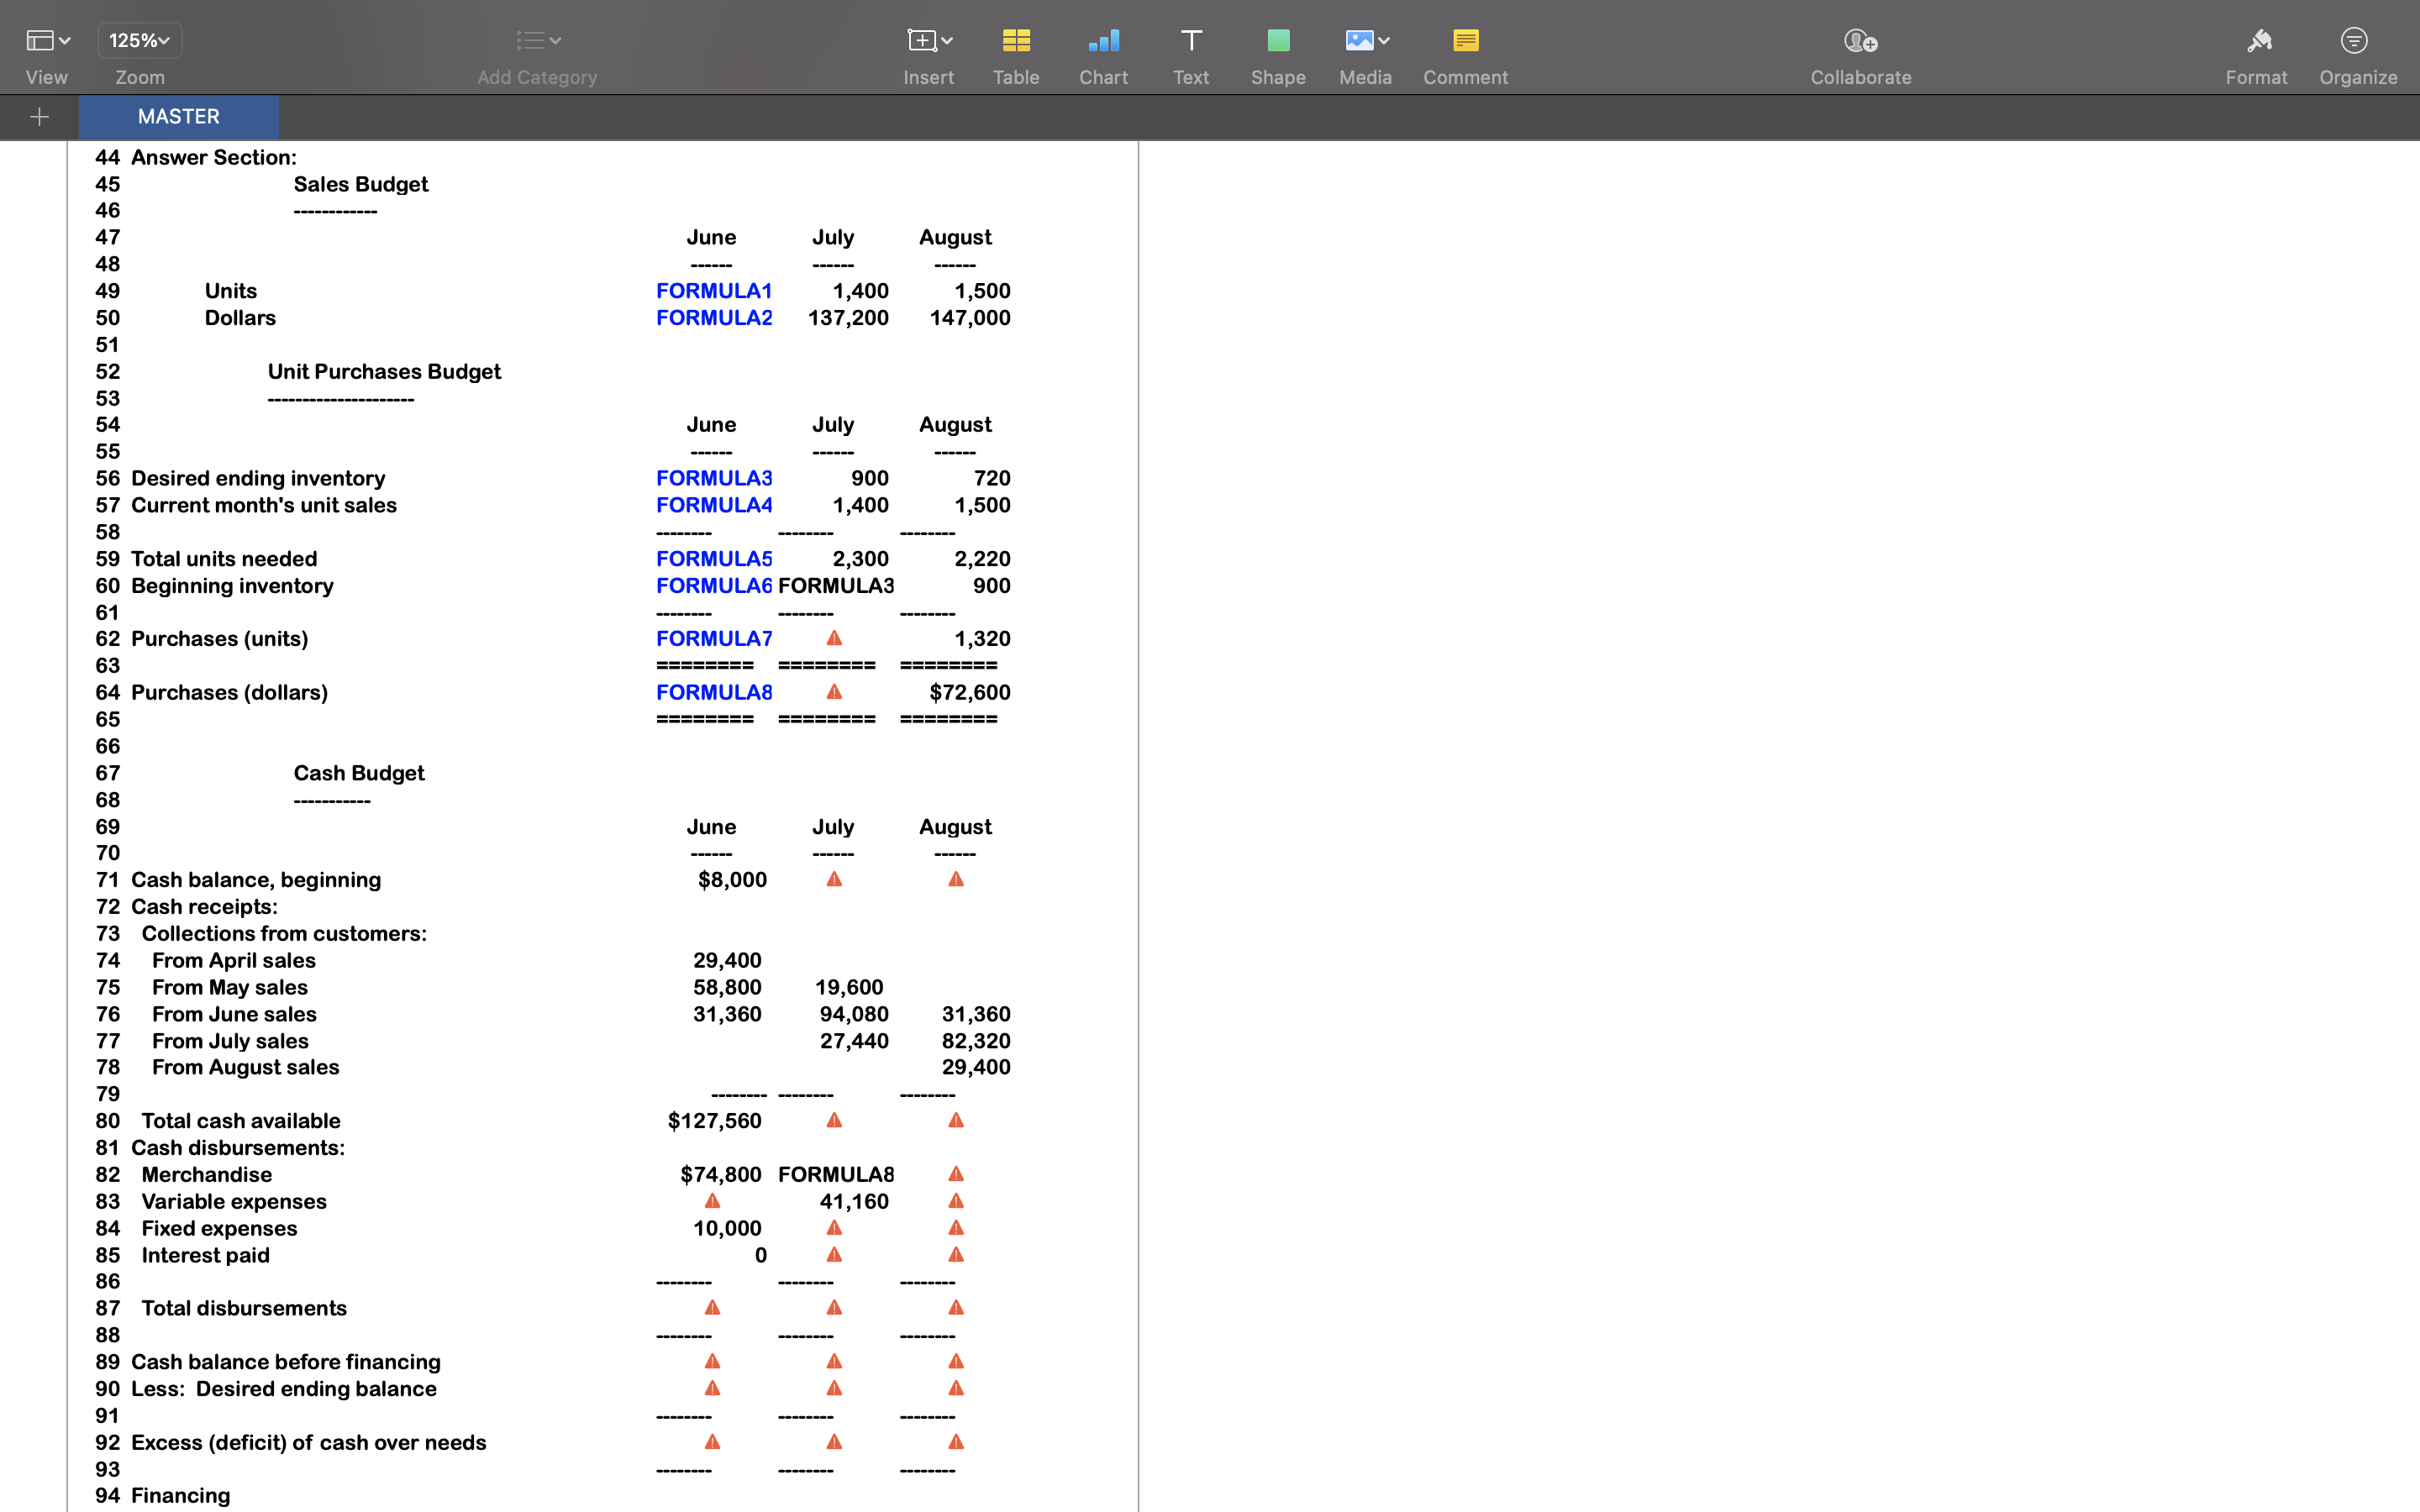
125% F V View Zoom Add Category Insert Table Chart Text Shape Media Comment Collaborate Format Organize MASTER MASTER Student Name => Section Number => C D E 6 Data Section: 7 Actual and Budgeted Unit Sale 9 April 1,500 10 May 1,000 11 June 1,600 12 July 1,400 13 August 1,500 14 September 1,200 15 16 Balance Sheet, May 31, 19X5 17 Cash $8,000 18 Accounts receivable 107,800 19 Merchandise inventory 52,800 20 Fixed assets (net) 130,000 21 22 Total assets $298,600 23 24 Accounts payable (merchandise) $74,800 25 Owner's equity 223,800 26 27 Total liabilities & equity $298,600 28 29 30 Average selling price $98 31 Average purchase cost per unit $55 32 Desired ending inventory 33 (% of next month's unit sales) 60% 34 Collections from customers: 35 Collected in month of sale 20% 36 Collected in month after sale 60% 37 Collected two months after sale 20% 38 Projected cash payments: 39 Variable expenses 30% of sales 40 Fixed expenses (per month) $10,000 41 Depreciation per month $1,000 42 43 - 44 Answer Section: 45 Sales Budget 46 47 June July August 48 49 Units FORMULA1 1,400 1,500 50 Dollars FORMULA2 137,200 147,000125% Collaborate Format Organize View Zoom Add Category Insert Table Chart Text Shape Media Comment MASTER 44 Answer Section: 45 Sales Budget 46 47 June July August 48 49 Units FORMULA1 1,400 1,500 50 Dollars FORMULA2 137,200 147,000 51 52 Unit Purchases Budget 53 54 June July August 55 56 Desired ending inventory FORMULA3 900 720 57 Current month's unit sales FORMULA4 1,400 1,500 58 59 Total units needed FORMULA5 2,300 2,220 60 Beginning inventory FORMULA6 FORMULA3 900 61 62 Purchases (units) FORMULA 1,320 63 64 Purchases (dollars) FORMULA8 $72,600 65 66 67 Cash Budget 68 69 June July August 70 71 Cash balance, beginning $8,000 72 Cash receipts: 73 ctions from customers: 74 From April sales 29,400 75 From May sales 58,800 19,600 76 From June sales 31,360 94,080 31,360 77 From July sales 27,440 82,320 78 From August sales 29,400 79 80 Total cash available $127,560 81 Cash disburser 82 Merchandise $74,800 FORMULA8 D 83 Variable expenses 41,160 84 Fixed expenses 10,000 85 Interest paid 0 86 87 Total disbursements 88 89 Cash balance before financing 90 Less: Desired ending balance 91 92 Excess (deficit) of cash over needs 93 94 Financing125% Add Category Insert Table Chart Text Shape Media Comment Collaborate Format Organize View Zoom MASTER 95 Borrowing 96 Repayment 97 98 Total effects of financing 99 100 Cash balance, ending 101 102 103 Forecasted Income Statement 104 For Quarter Ended August 31, 19X5 105 106 Sales FORMULA16 107 Cost of goods sold FORMULA17 108 109 Gross profit FORMULA18 110 111 Expenses: 112 Variable expenses FORMULA19 Fixed expenses FORMULA20 114 Depreciation expense FORMULA21 115 Interest expense FORMULA22 116 117 Total expenses $0 118 119 Net income A 120 121 122 Forecasted Balance Sheet 123 August 31, 19X5 124 125 Assets: 126 Cash FORMULA23 127 Accounts receivable FORMULA24 128 Merchandise inventory FORMULA25 129 Fixed assets (net) FORMULA26 130 131 Total assets $0 132 133 Liabilities & equity: 134 Accounts payable FORMULA27 135 Loans payable A 136 Owner's equity FORMULA28 137 138 Total liabilities & equity 139 140
Step by Step Solution
There are 3 Steps involved in it

Get step-by-step solutions from verified subject matter experts