

Question: I NEED HELP WITH THIS QUESTION PLEASE: Click this linkto download the spreadsheet for use in this activity (DATA SHOWN IN SCREEN SHOT BELOW) .
I NEED HELP WITH THIS QUESTION PLEASE: Click this linkto download the spreadsheet for use in this activity (DATA SHOWN IN SCREEN SHOT BELOW) . Use the Regression function in the Data Analysis ToolPak. Specify the data range for the response variable in "Input Y Range" and the data range for the explanatory variable in "Input X Range".
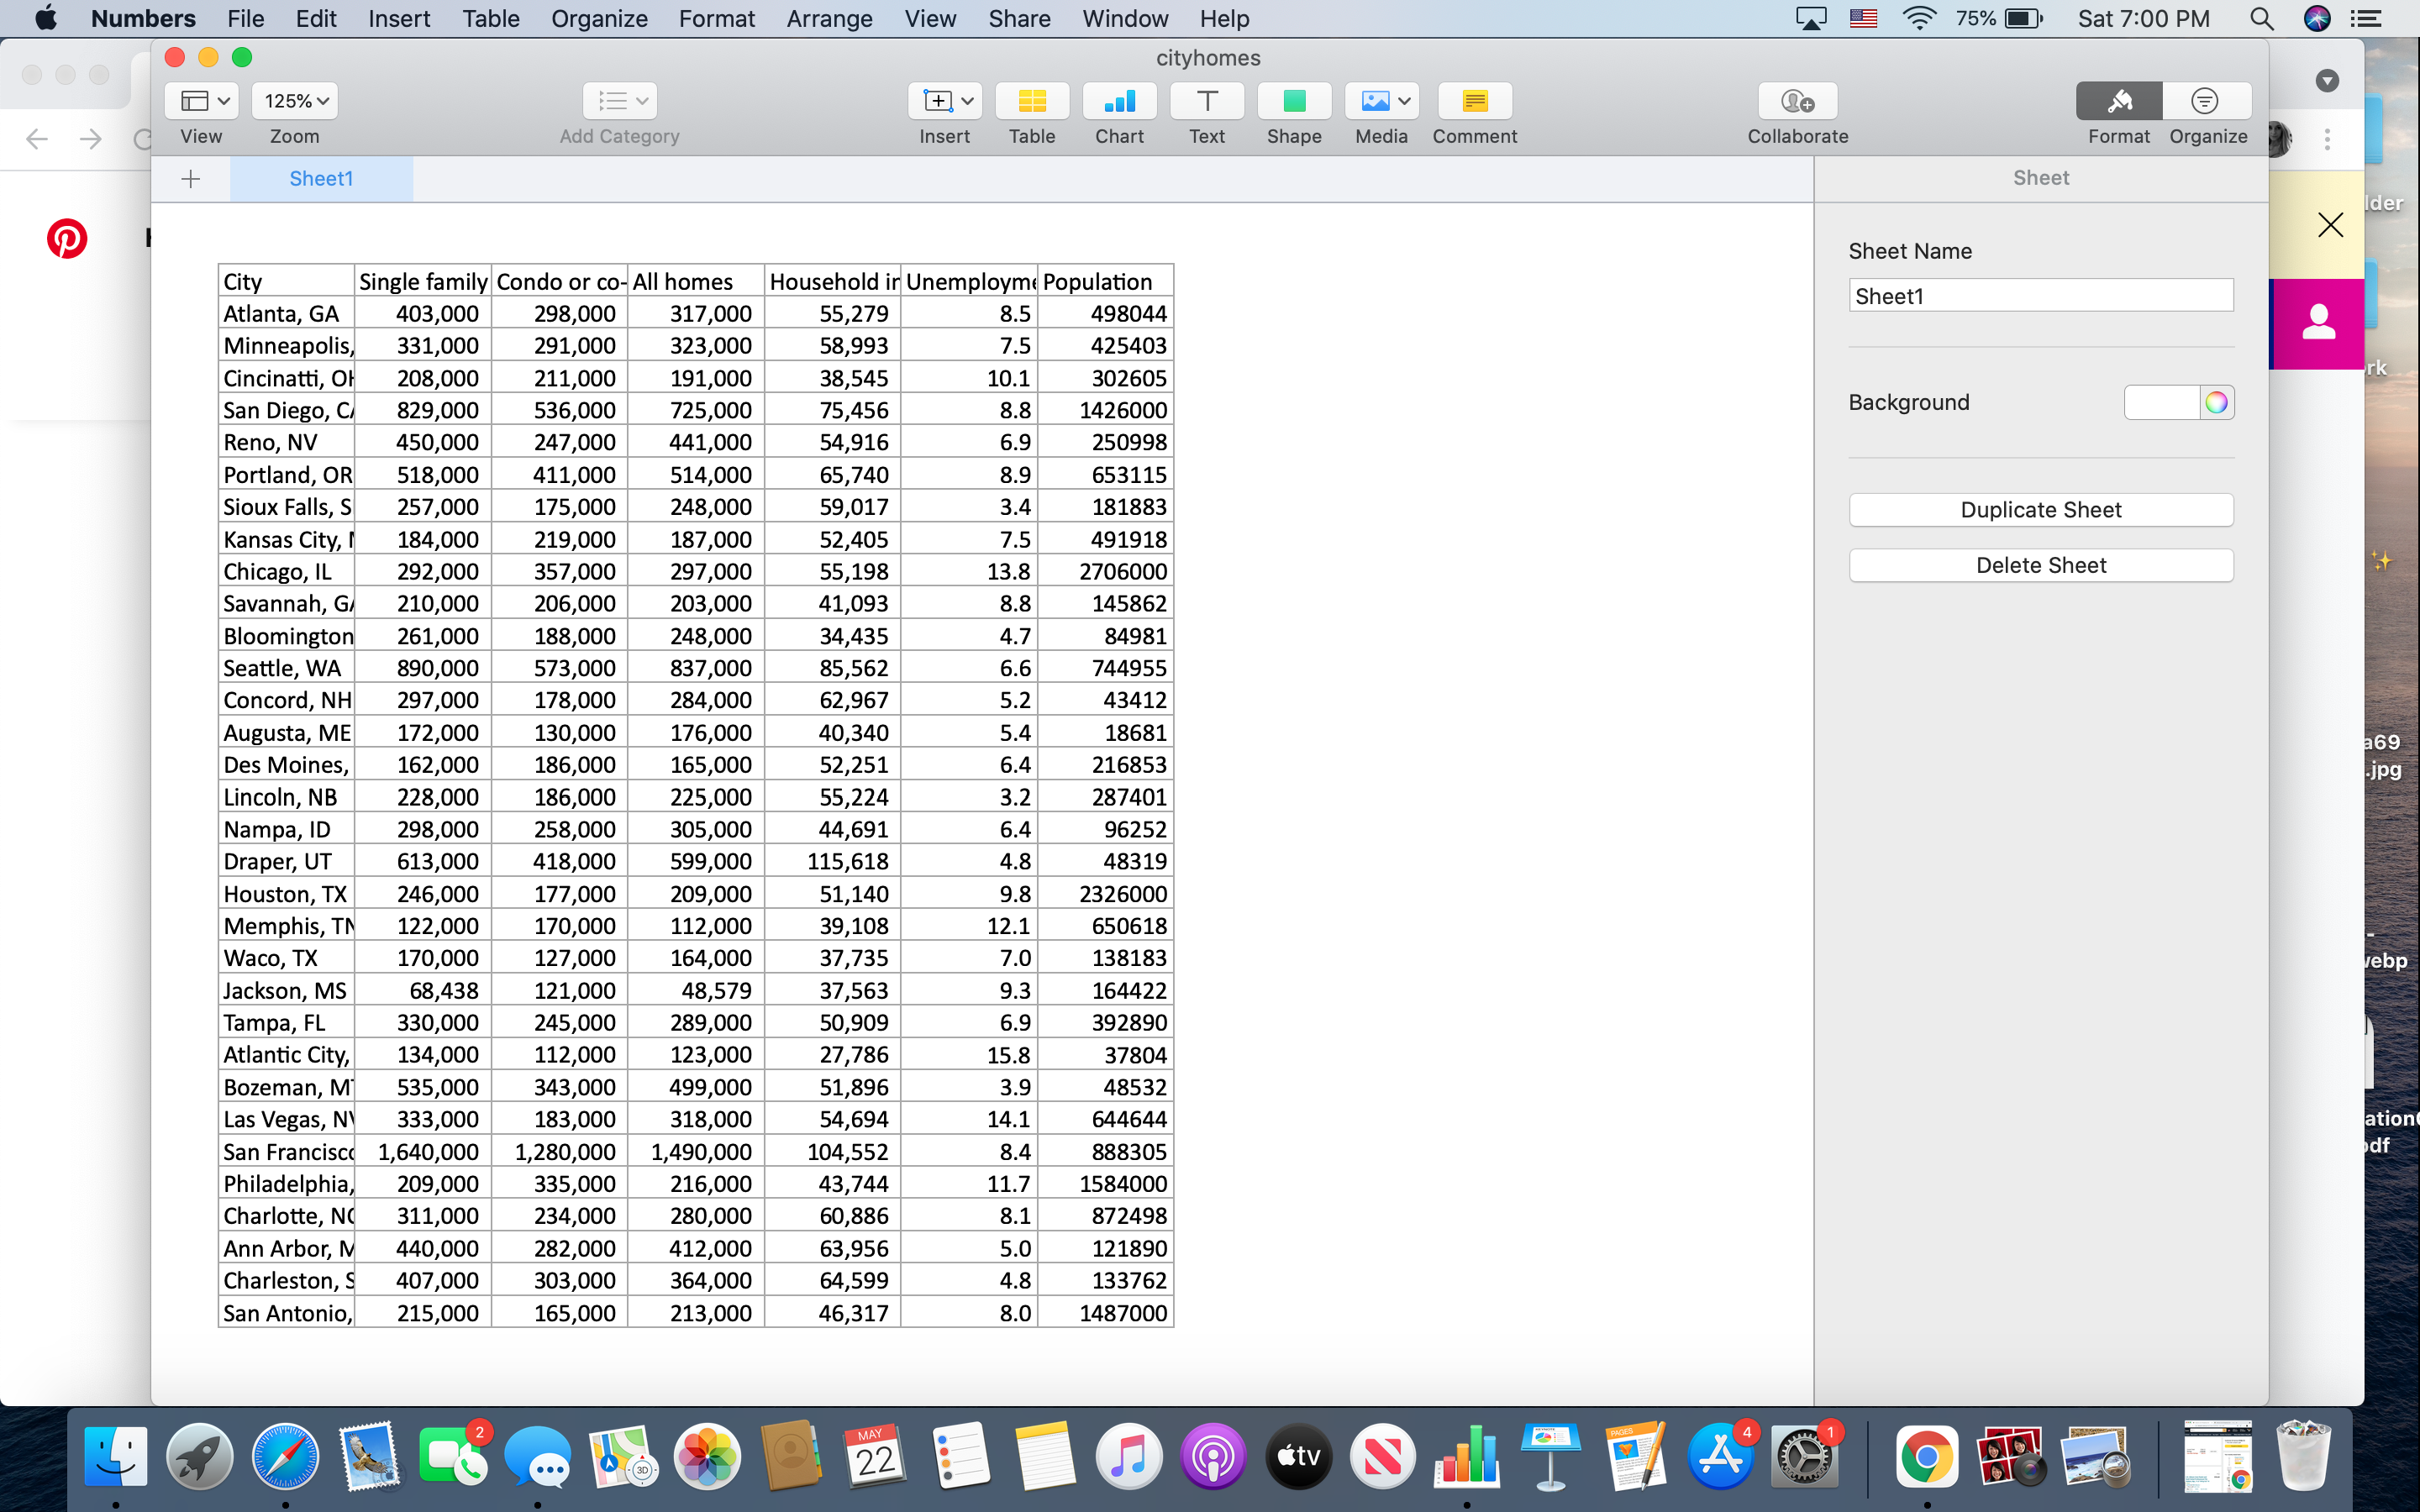
A researcher is analyzing the relationship between various variables in housing data for 32
cities: median list prices of single family homes, condominium or co-ops, all homes, median household income, unemployment rate, and population.
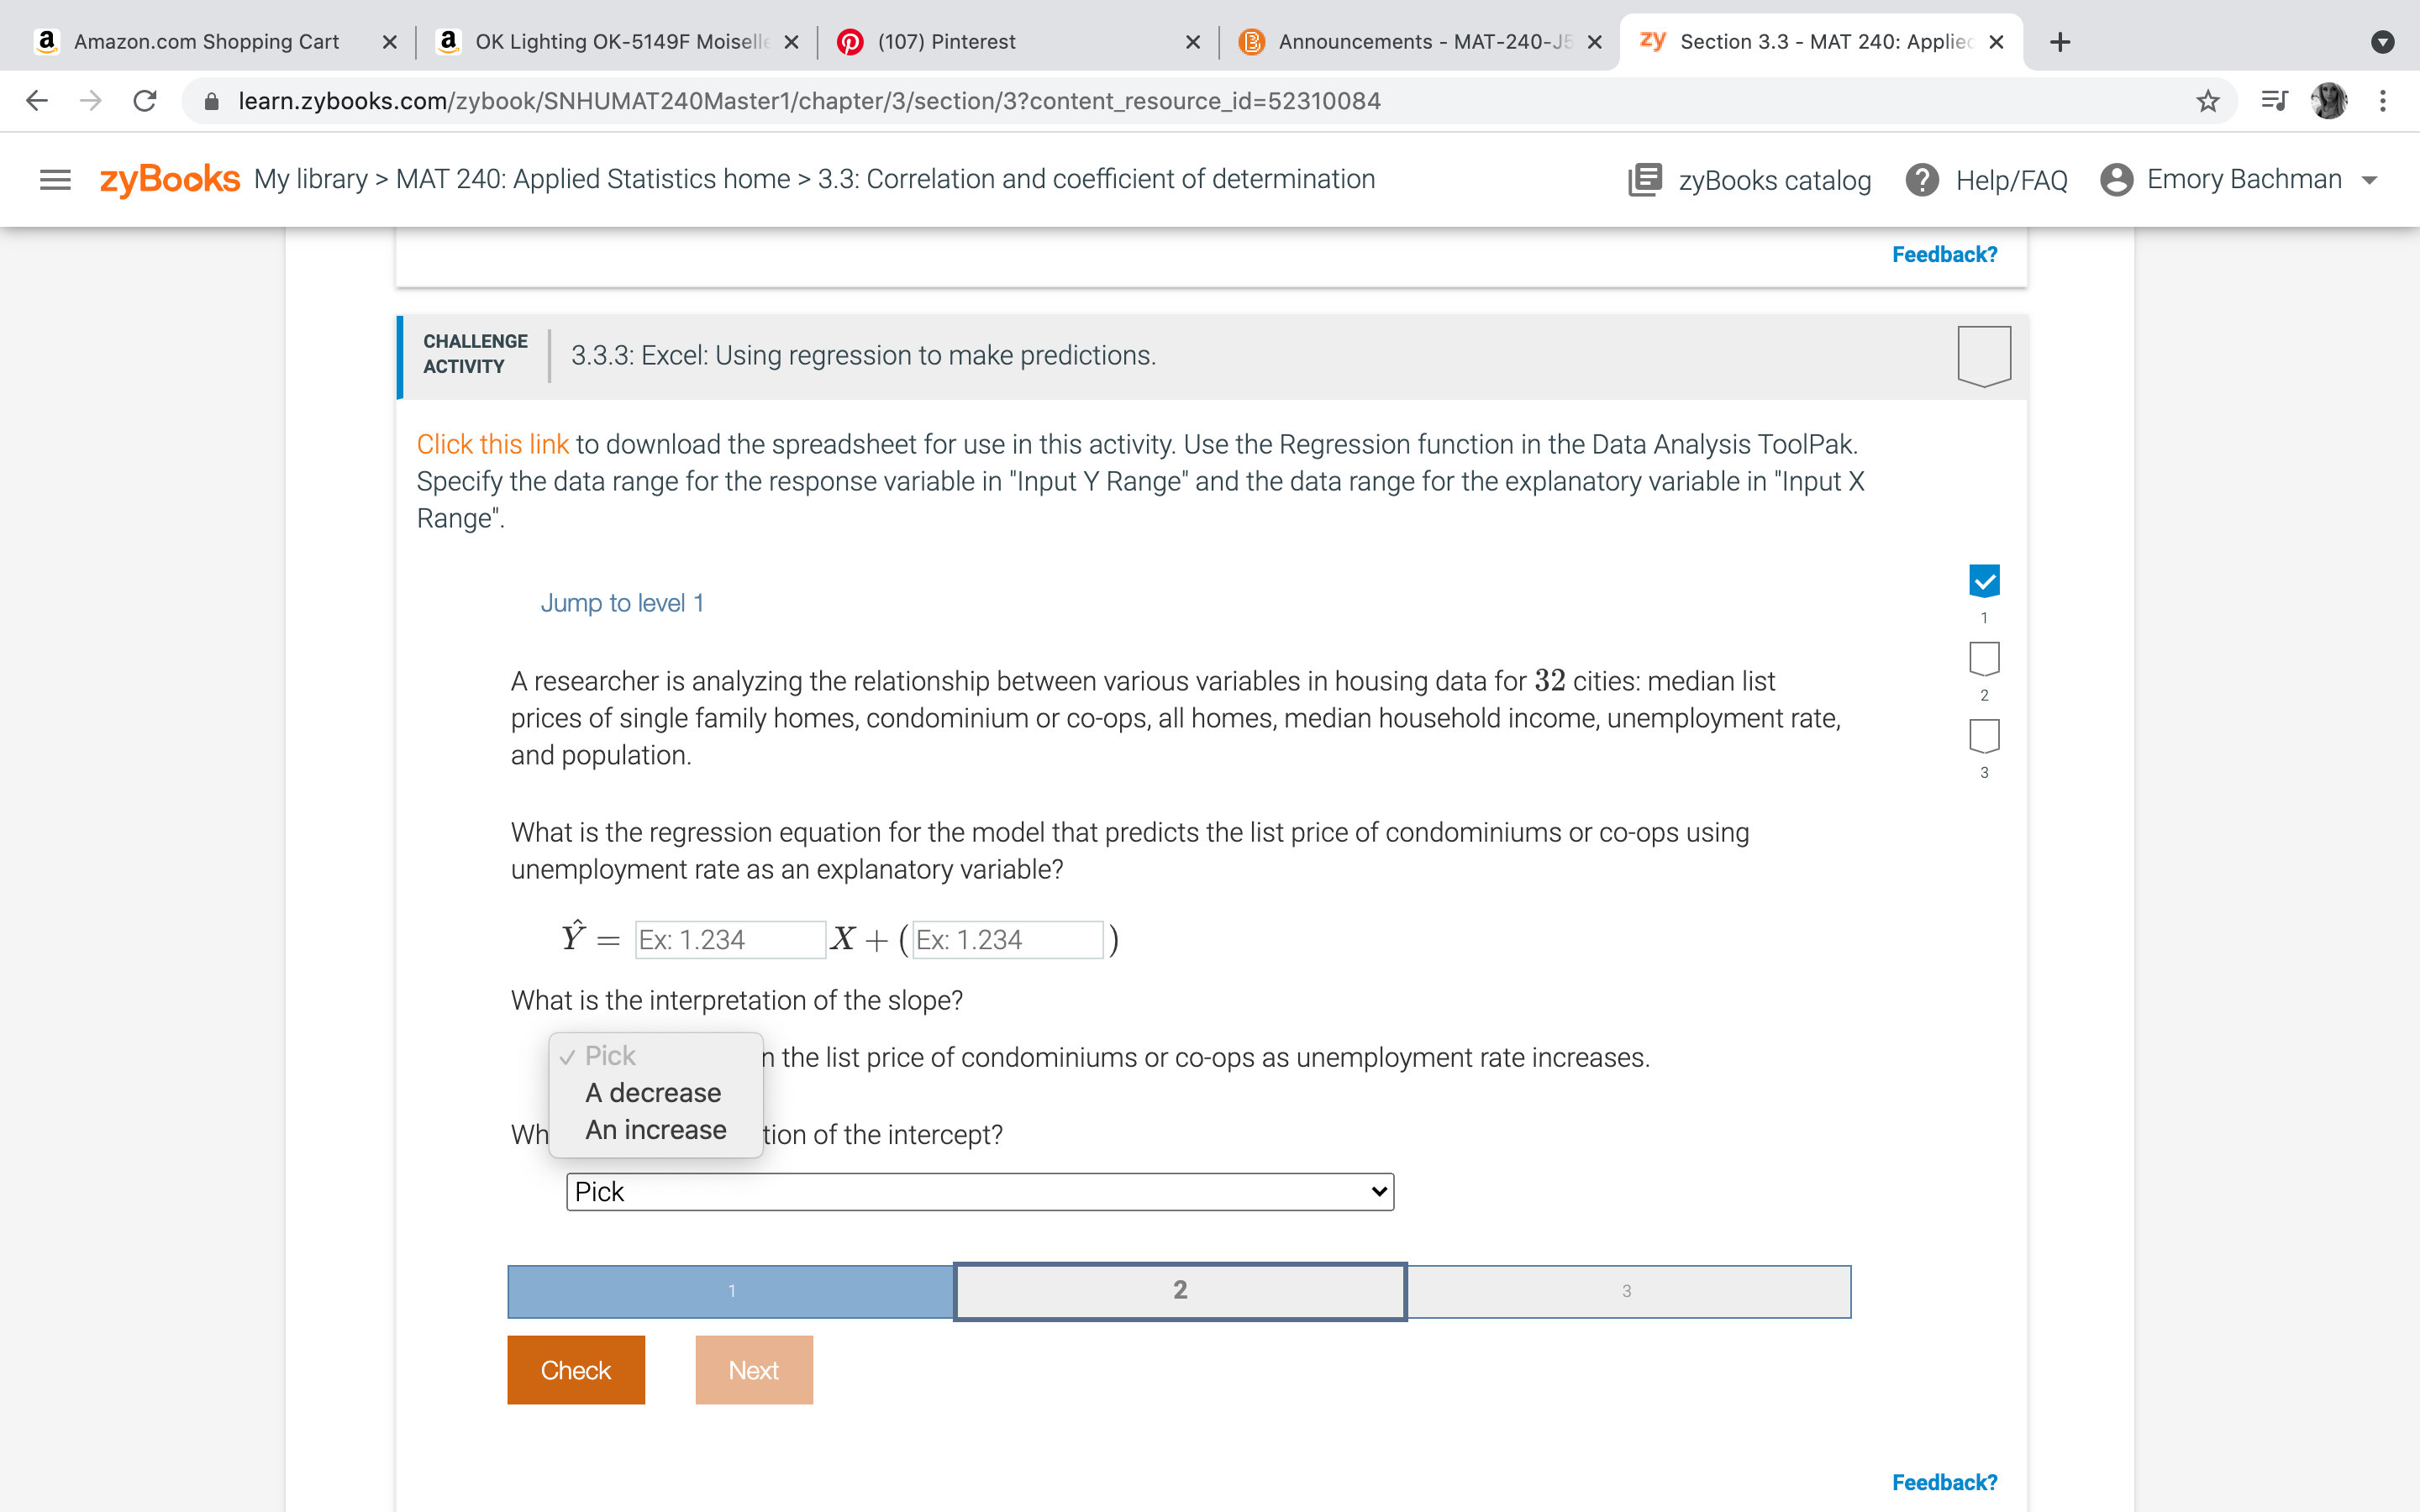
What is the regression equation for the model that predicts the list price of condominiums or co-ops using unemployment rate as an explanatory variable?
What is the interpretation of the slope?
(A Decrease OR an Increase)
in the list price of condominiums or co-ops as unemployment rate increases.
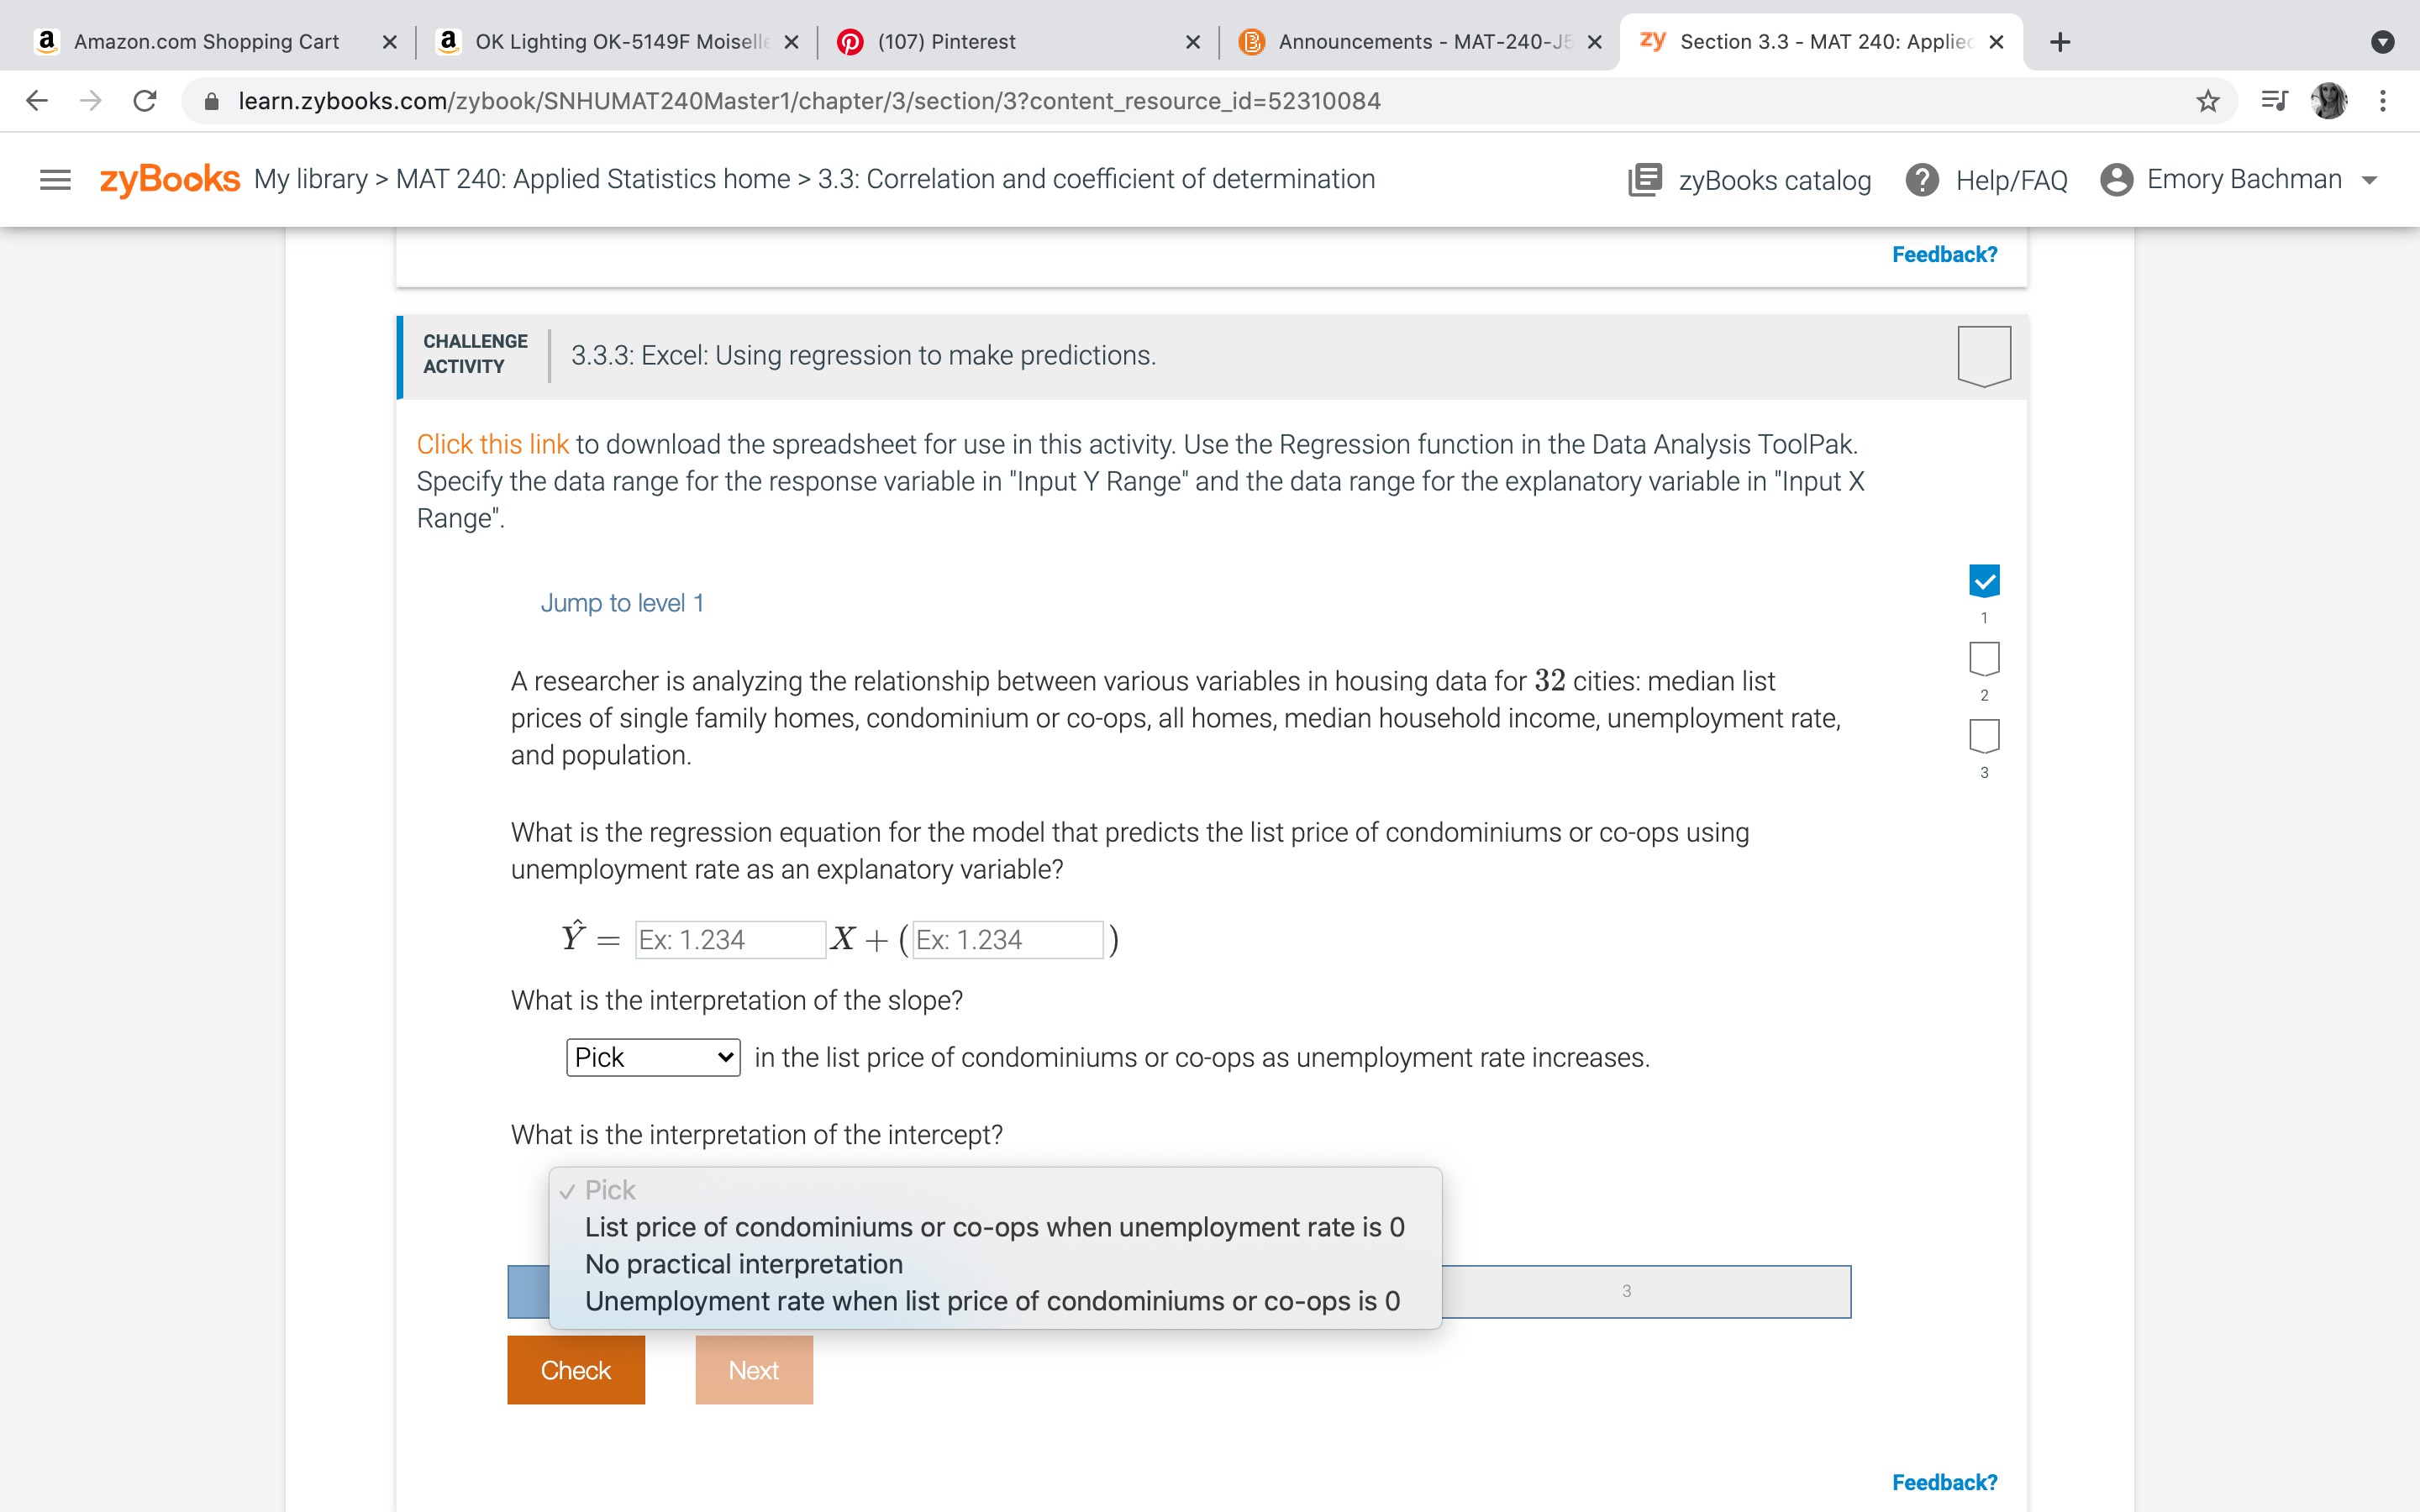
What is the interpretation of the intercept?
List price of condominiums and/or co-ops when the employment rate is 0
OR
No practical Interpretation
OR
Unemployment rate when list price of condominiums and co-ops is 0
DATA:
Help 75% Sat 7:00 PM Q DE Numbers File Edit Insert Table Organize Format Arrange View Share Window cityhomes 125% Ev T View Zoom Add Category Insert Table Chart Text Shape Media Comment Collaborate Format Organize . . . Sheet + Sheet1 Ider X Sheet Name City Single family Condo or co- All homes Household ir Unemploymentlation Sheet1 Atlanta, GA 403,000 298,000 317,000 55,279 8.5 498044 Minneapolis, 331,000 291,000 323,000 58,993 7.5 425403 rk Cincinatti, OH 208,000 211,000 191,000 38,545 10.1 302605 Background San Diego, C 829,000 536,000 725,000 75,456 8.8 1426000 Reno, NV 450,000 247,000 441,000 54,916 6.9 250998 Portland, OR 518,000 411,000 514,000 65,740 3.9 653115 Sioux Falls, S 257,000 175,000 248,000 59,017 3.4 181883 plicate Sheet Kansas City, I 184,000 219,000 187,000 52,405 7.5 491918 Delete Shee Chicago, IL 292,000 357,000 297,000 55,198 13.8 2706000 Savannah, G 210,000 206,000 203,000 41,093 8.8 145862 Bloomington 261,000 188,000 248,000 34,435 4.7 84981 Seattle, WA 890,000 573,000 37,000 85,562 6.6 744955 Concord, NH 297,000 178,000 284,000 62,967 5.2 43412 Augusta, ME 172,000 130,000 176,000 40,340 5.4 18681 a69 Des Moines, 162,000 186,000 165,000 52,251 6.4 216853 .jpg Lincoln, NB 228,000 186,000 225,000 55,224 3.2 287401 Nampa, ID 298,000 258,000 305,000 44,691 6.4 96252 Draper, UT 613,000 418,000 599,000 115,618 4.8 48319 Houston, TX 246,000 177,000 209,000 51,140 9.8 2326000 Memphis, TN 122,000 170,000 112,000 39,108 12.1 650618 ebp Waco, TX 170,000 127,000 164,000 37,735 7.0 138183 Jackson, MS 68,438 121,000 48,579 37,563 9.3 164422 Tampa, FL 330,000 245,000 289,000 50,909 6.9 392890 Atlantic City, 134,000 112,000 123,000 27,786 15.8 37804 Bozeman, M 535,000 343,000 499,000 51,896 3.9 48532 ation Las Vegas, NY 333,000 183,000 318,000 54,694 14.1 644644 San Francisco 1,640,000 1,280,000 1,490,000 104,552 8.4 888305 Philadelphia, 209,000 335,000 216,000 43,744 11.7 1584000 Charlotte, NO 311,000 234,000 280,000 60,886 8.1 872498 Ann Arbor, M 440,000 282,000 412,000 63,956 5.0 121890 Charleston, S 407,000 303,000 364,000 64,599 4.8 133762 San Antonio, 215,000 165,000 213,000 46,317 8.0 1487000 2 MAY 22 itv Oul T 4g, Amazoncom Shopping Cart X I Q, 0K Lighting 0K5149F Moiselle x I Q (107) Pinterest X I Announcements-MAT-240JE x zy Section 3.3MAT 240:Appliel X + o (- $ C i learn.zybooks.com/zybook/SNHUMAT240Master1/chapter/3/section/3?content_resource_id=52310084 '3! 51 '. 3 E zyBooks My library > MAT 240: Applied Statistics home > 3.3: Correlation and coefcient of determination | zyBooks catalog 0 Help/FAQ e Emory Bachman v Feedback! $355\" I 3.3.3: Excel: Using regression to make predictions. U Click this link to download the spreadsheet for use in this activity. Use the Regression function in the Data Analysis ToolPak. Specify the data range for the response variable in "Input Y Range" and the data range for the explanatory variable in "input X Range". Jump to level 1 A researcher is analyzing the relationship between various variables in housing data for 32 cities: median list prices of single family homes, condominium or co-ops, all homes, median household income, unemployment rate, and population. V What is the regression equation for the model that predicts the list price of condominiums or co-ops using unemployment rate as an explanatory variable? Y = Ex: 1.234 X+ ( Ex: 1.234 ) What is the interpretation of the slope? Pick h the list price of condominiums or coops as unemployment rate increases. A decrease An increase ion of the intercept? Feedback? g Amazoncom Shopping Cart X I Q, 0K Lighting 0K5149F Moisellr x I 0 (107) Pinterest X I Announcements-MAT-ZAOJE X zy Section 3.3MAT 240:Applie X + o (- 6 C i learn.zybooks.com/zybook/SNHUMAT240Master1/chapter/3/section/3?content_resource_id=52310084 '3! 51 '. 5 E zyBooks My libraly > MAT 240: Applied Statistics home > 3.3: Correlation and coefcient of determination E zyBooks catalog 0 Help/FAQ e Emory Bachman v Feedback? I :mg\" I 3.3.3: Excel: Using regression to make predictions. U Click this link to download the spreadsheet for use in this activity. Use the Regression function in the Data Analysis ToolPak. Specify the data range for the response variable in "Input Y Range" and the data range for the explanatory variable in "Input X Range". Jump to level 1 A researcher is analyzing the relationship between various variables in housing data for 32 cities: median list prices of single family homes, condominium or co-ops, all homes, median household income, unemployment rate, and population. V What is the regression equation for the model that predicts the list price of condominiums or co-ops using unemployment rate as an explanatory variable? Y: 3.11234\" X+(Ex:'1.234 " ') What is the interpretation of the slope? in the list price of condominiums or coops as unemployment rate increases. What is the interpretation of the intercept? v Pick List price of condominiums or co-ops when unemployment rate is 0 No practical interpretation Unemployment rate when list price of condominiums or co-ops is 0 Feedback
Step by Step Solution
There are 3 Steps involved in it

Get step-by-step solutions from verified subject matter experts