

Question: How do I go about this? Below is a position vs. time graph of my summer bicycle trip. 60A 50 position (miles) 40 30 20

How do I go about this?

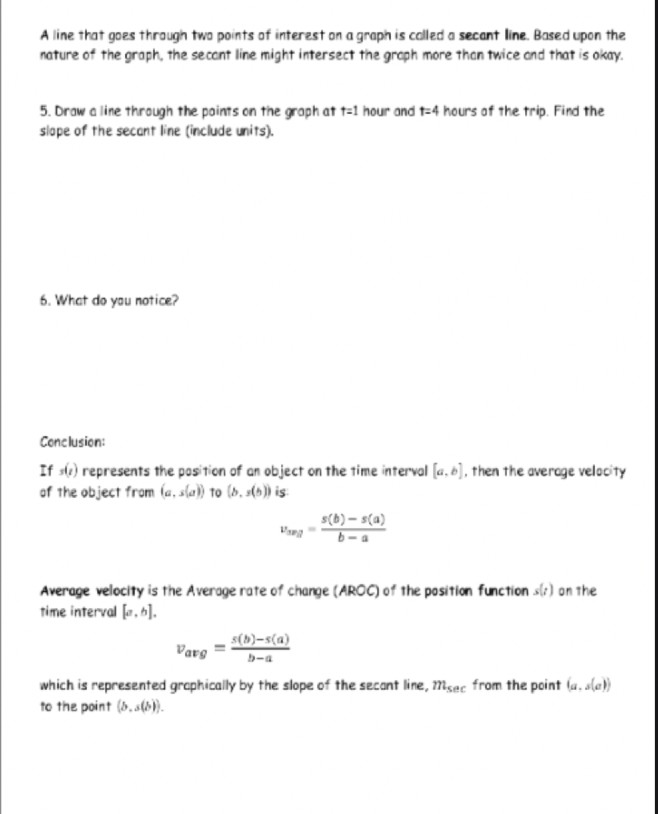
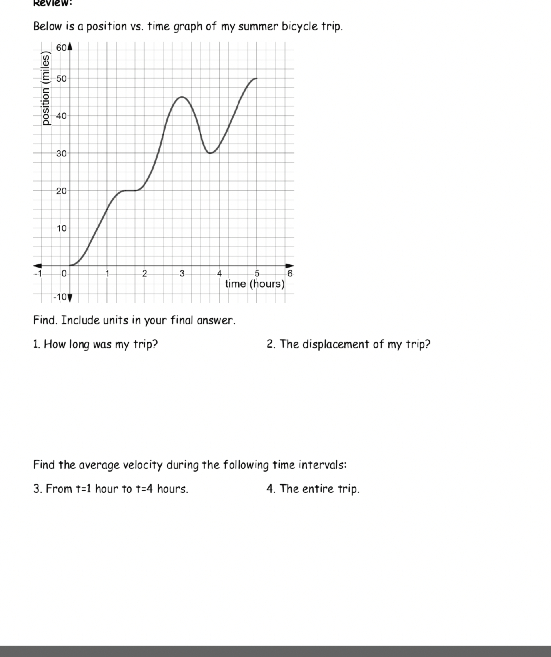
Below is a position vs. time graph of my summer bicycle trip. 60A 50 position (miles) 40 30 20 10 -1 2 -3 5- time (hours) 107 Find. Include units in your final answer. 1. How long was my trip? 2. The displacement of my trip? Find the average velocity during the following time intervals: 3. From +=1 hour to +=4 hours. 4. The entire trip.A line that goes through two points of interest on a graph is called a secant line. Based upon the nature of the graph, The secont line might intersect the graph more than twice and that is okay. 5. Draw a line through the paints on the graph at t=1 hour and 1=4 hours of the trip. Find the slope of the secant line (include units). 6. What do you notice? Conclusion: If s() represents the position of an object on the time interval [a, ], then the average velocity of the object from (a, s(a)) to (o. s(5)) is s(b) - s(a) b-a Average velocity is the Average rate of change (AROC) of the position function s() on the time interval [a. b]. s(b)-s(a) Varg which is represented graphically by the slope of the secant line, miser from the point (a. s(e)) to the point (b. s())
Step by Step Solution
There are 3 Steps involved in it

Get step-by-step solutions from verified subject matter experts