

Question: How do I graph iii? A recent article in the Washington Post entitled Millennials are picking pets over people argued that pets are becoming a
How do I graph iii?
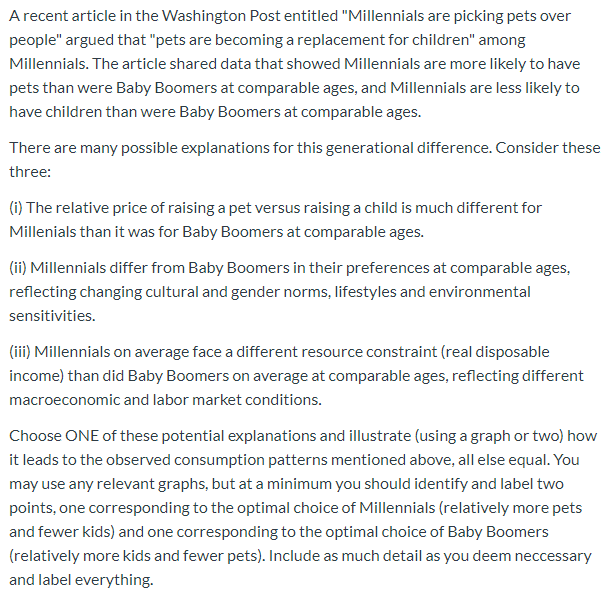
A recent article in the Washington Post entitled "Millennials are picking pets over people" argued that "pets are becoming a replacement for children" among Millennials. The article shared data that showed Millennials are more likely to have pets than were Baby Boomers at comparable ages, and Millennials are less likely to have children than were Baby Boomers at comparable ages. There are many possible explanations for this generational difference. Consider these three: (i) The relative price of raising a pet versus raising a child is much different for Millenials than it was for Baby Boomers at comparable ages. (ii) Millennials differ from Baby Boomers in their preferences at comparable ages, reflecting changing cultural and gender norms, lifestyles and environmental sensitivities. (iii) Millennials on average face a different resource constraint (real disposable income) than did Baby Boomers on average at comparable ages, reflecting different macroeconomic and labor market conditions. Choose ONE of these potential explanations and illustrate (using a graph or two) how it leads to the observed consumption patterns mentioned above, all else equal. You may use any relevant graphs, but at a minimum you should identify and label two points, one corresponding to the optimal choice of Millennials (relatively more pets and fewer kids) and one corresponding to the optimal choice of Baby Boomers (relatively more kids and fewer pets). Include as much detail as you deem neccessary and label everything. A recent article in the Washington Post entitled "Millennials are picking pets over people" argued that "pets are becoming a replacement for children" among Millennials. The article shared data that showed Millennials are more likely to have pets than were Baby Boomers at comparable ages, and Millennials are less likely to have children than were Baby Boomers at comparable ages. There are many possible explanations for this generational difference. Consider these three: (i) The relative price of raising a pet versus raising a child is much different for Millenials than it was for Baby Boomers at comparable ages. (ii) Millennials differ from Baby Boomers in their preferences at comparable ages, reflecting changing cultural and gender norms, lifestyles and environmental sensitivities. (iii) Millennials on average face a different resource constraint (real disposable income) than did Baby Boomers on average at comparable ages, reflecting different macroeconomic and labor market conditions. Choose ONE of these potential explanations and illustrate (using a graph or two) how it leads to the observed consumption patterns mentioned above, all else equal. You may use any relevant graphs, but at a minimum you should identify and label two points, one corresponding to the optimal choice of Millennials (relatively more pets and fewer kids) and one corresponding to the optimal choice of Baby Boomers (relatively more kids and fewer pets). Include as much detail as you deem neccessary and label everything
Step by Step Solution
There are 3 Steps involved in it

Get step-by-step solutions from verified subject matter experts