

Question: How do I graph this datas. Non-smokers Subject - 2 3 4 5 6 7 8 9 10 Initial pulse 78 81 83 77 81
How do I graph this datas.
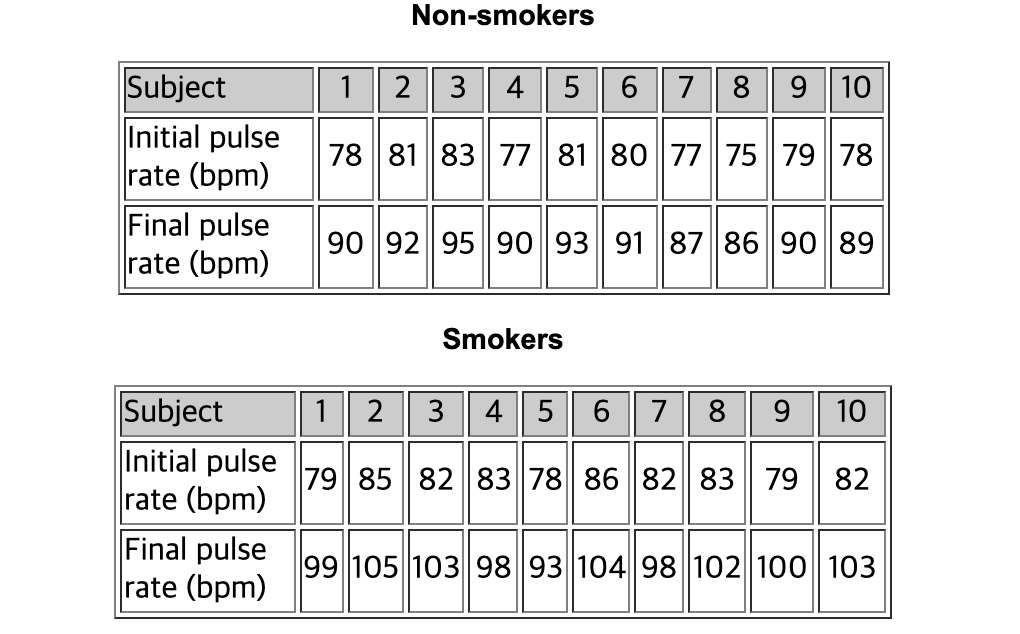
Non-smokers Subject - 2 3 4 5 6 7 8 9 10 Initial pulse 78 81 83 77 81 80 77 75 79 78 rate (bpm) Final pulse 90 92 95 90 93 91 187 86 90 rate (bpm) 189 Smokers Subject 2 3 4 5 6 7 8 9 10 Initial pulse 79 85 82 83 78 86 82 83 79 82 rate (bpm) Final pulse 99 105 103 98 93 104 98 102 100 103 rate (bpm)
Step by Step Solution
There are 3 Steps involved in it
1 Expert Approved Answer
Step: 1 Unlock

Question Has Been Solved by an Expert!
Get step-by-step solutions from verified subject matter experts
Step: 2 Unlock
Step: 3 Unlock