

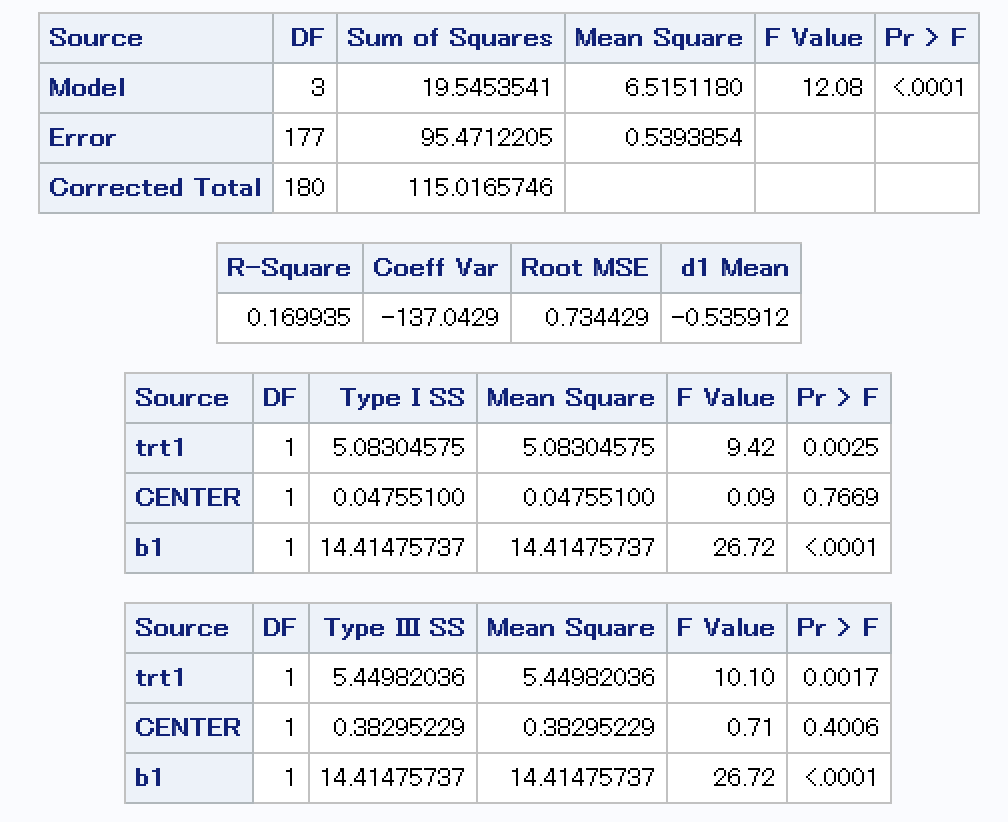
Question: How do I interpret SAS output for ANCOVA? How to examine the association between treatment and each component of ACR individually, adjusting for both center
How do I interpret SAS output for ANCOVA? How to examine the association between treatment and each component of ACR individually, adjusting for both center and baseline value of the outcome variable. For example, you will model the association between d1 and treatment adjusting for both center and b1?
\f
Step by Step Solution
There are 3 Steps involved in it
1 Expert Approved Answer
Step: 1 Unlock

Question Has Been Solved by an Expert!
Get step-by-step solutions from verified subject matter experts
Step: 2 Unlock
Step: 3 Unlock