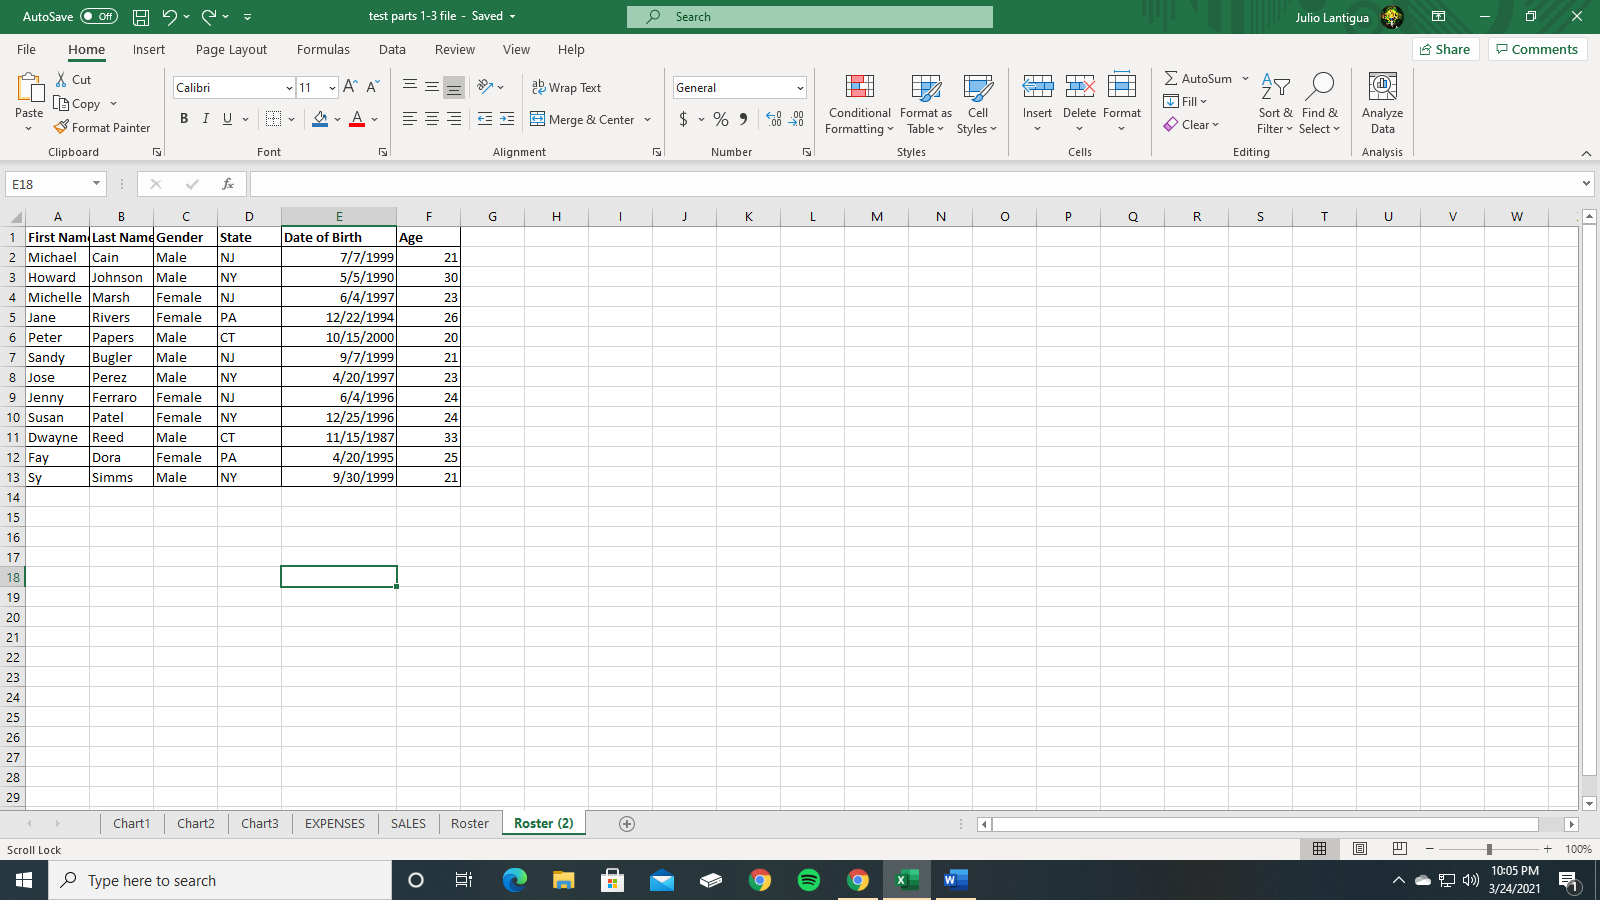
Question: How do I make a Pivot Table that reports data grouped by the Gender and State columns. By the way, it has to calculate the

How do I make a Pivot Table that reports data grouped by the Gender and State columns. By the way, it has to calculate the following for each Gender and State:

The number (count) of rows (individuals) and The average of age.

How do I make a Pivot Table that reports data
Julio Lantigua X AutoSave . Off test parts 1-3 file - Saved . Search Share Comments File Home Insert Page Layout Formulas Data Review View Help X Cut Calibri 11 ~ A" A ae Wrap Text General LIX _ AutoSum Fill [B Copy Cell Insert Delete Format Sort & Find & Analyze Paste BIU E Merge & Center $ ~ % 9 08 28 Conditional Format as Clear Data Format Painter Formatting * Table Styles Filter * Select v Number Styles Cells Editing Analysis Clipboard Font Alignment E18 X V P R S T U V W A B E F G H J K L M N O Q First Nam Last Name Gender State Date of Birth Age 2 Michael | Cain Male NJ 7/7/1999 21 3 Howard Johnson Male NY 5/5/1990 30 4 Michelle Marsh Female NJ 6/4/1997 23 5 Jane Rivers Female PA 12/22/1994 26 6 Peter Papers Male CT 10/15/2000 20 7 Sandy Bugler Male NJ 9/7/1999 21 8 Jose Perez Male NY 4/20/1997 23 9 Jenny Ferraro Female NJ 6/4/1996 24 10 Susan Pate Female NY 12/25/1996 24 11 Dwayne Reed Male CT 11/15/1987 33 12 Fay Dora Female PA 4/20/1995 25 13 Sy Simms Male NY 9/30/1999 21 14 15 16 17 18 19 20 21 25 26 27 28 29 Chart1 Chart2 Chart3 EXPENSES SALES Roster Roster (2) + - - + 100% Scroll Lock 10:05 Type here to search O 9 9 X w 3/24/2021

Step by Step Solution

There are 3 Steps involved in it

1 Expert Approved Answer
Step: 1 Unlock blur-text-image
Question Has Been Solved by an Expert!

Get step-by-step solutions from verified subject matter experts

Step: 2 Unlock
Step: 3 Unlock

Students Have Also Explored These Related Finance Questions!