Question: How do I make this a Monte Carlo Simulation step by step in excel Project Type, Frequency and Time Project Type Frequency Time Duration Minor

How do I make this a Monte Carlo Simulation step by step in excelHow do I make this a Monte Carlo Simulation step

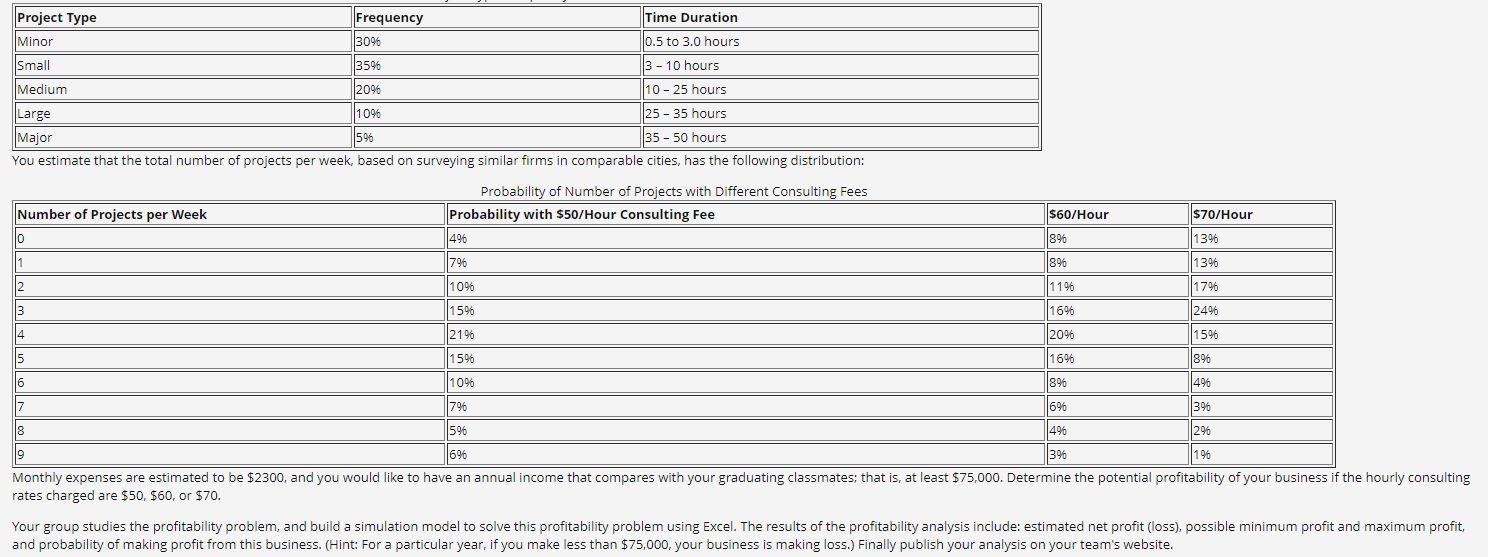
  1. Project Type, Frequency and Time
    Project Type Frequency Time Duration
    Minor 30% 0.5 to 3.0 hours
    Small 35% 3 10 hours
    Medium 20% 10 25 hours
    Large 10% 25 35 hours
    Major 5% 35 50 hours

    You estimate that the total number of projects per week, based on surveying similar firms in comparable cities, has the following distribution:

    Probability of Number of Projects with Different Consulting Fees
    Number of Projects per Week Probability with $50/Hour Consulting Fee $60/Hour $70/Hour
    0 4% 8% 13%
    1 7% 8% 13%
    2 10% 11% 17%
    3 15% 16% 24%
    4 21% 20% 15%
    5 15% 16% 8%
    6 10% 8% 4%
    7 7% 6% 3%
    8 5% 4% 2%
    9 6% 3% 1%

    Monthly expenses are estimated to be $2300, and you would like to have an annual income that compares with your graduating classmates; that is, at least $75,000. Determine the potential profitability of your business if the hourly consulting rates charged are $50, $60, or $70.

    Your group studies the profitability problem, and build a simulation model to solve this profitability problem using Excel. The results of the profitability analysis include: estimated net profit (loss), possible minimum profit and maximum profit, and probability of making profit from this business. (Hint: For a particular year, if you make less than $75,000, your business is making loss.) Finally publish your analysis on your team's website.

Project Type Frequency Time Duration Minor 30% 0.5 to 3.0 hours Small 3596 3 - 10 hours Medium 20% 10-25 hours Large 10% 25 - 35 hours Major ||596 35 - 50 hours You estimate that the total number of projects per week, based on surveying similar firms in comparable cities, has the following distribution: Probability of Number of Projects with Different Consulting Fees $60/Hour $70/Hour Number of Projects per Week Probability with $50/Hour Consulting Fee 0 ||496 896 13% 1 | 796 896 1396 1096 11% 2 17% 1596 1696 3 2496 2196 20% 14 15% 1596 16% 15 896 896 1496 16 1096 7 |79 |696 396 596 ||496 8 296 || 396 196 19 696 Monthly expenses are estimated to be $2300, and you would like to have an annual income that compares with your graduating classmates: that is, at least $75,000. Determine the potential profitability of your business if the hourly consulting rates charged are $50, $60, or $70. Your group studies the profitability problem, and build a simulation model to solve this profitability problem using Excel. The results of the profitability analysis include: estimated net profit (loss), possible minimum profit and maximum profit, and probability of making profit from this business. (Hint: For a particular year, if you make less than $75,000. your business is making loss.) Finally publish your analysis on your team's website

Step by Step Solution

There are 3 Steps involved in it

1 Expert Approved Answer
Step: 1 Unlock blur-text-image
Question Has Been Solved by an Expert!

Get step-by-step solutions from verified subject matter experts

Step: 2 Unlock
Step: 3 Unlock

Students Have Also Explored These Related General Management Questions!