

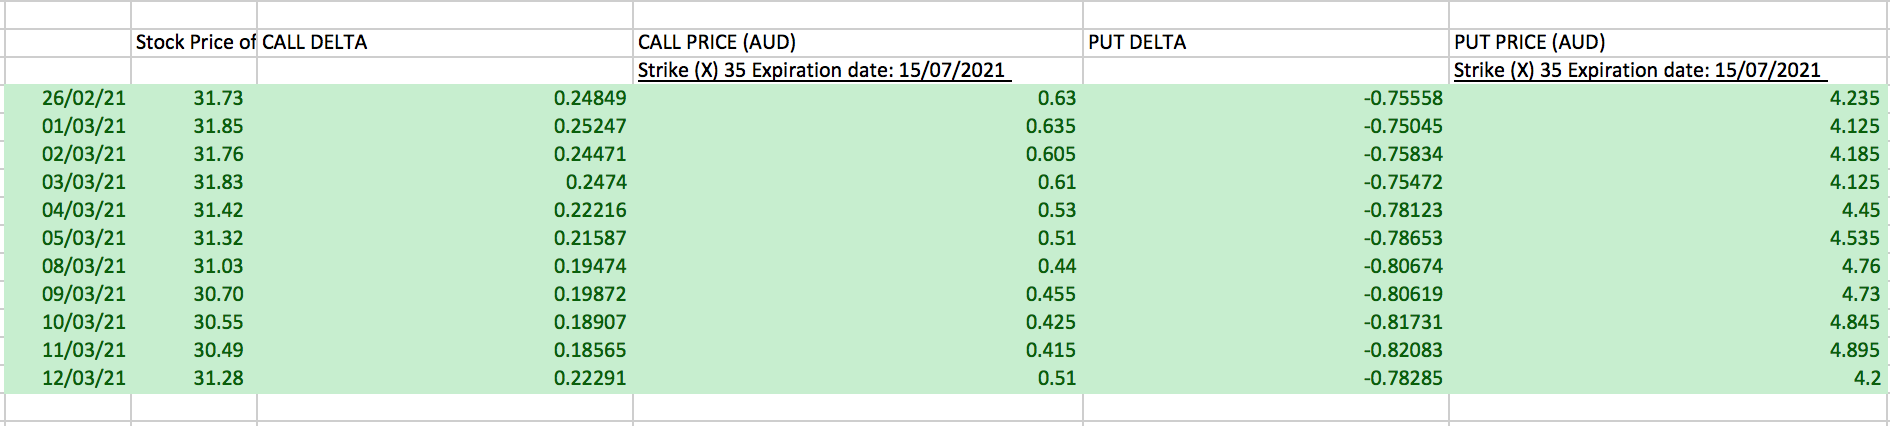
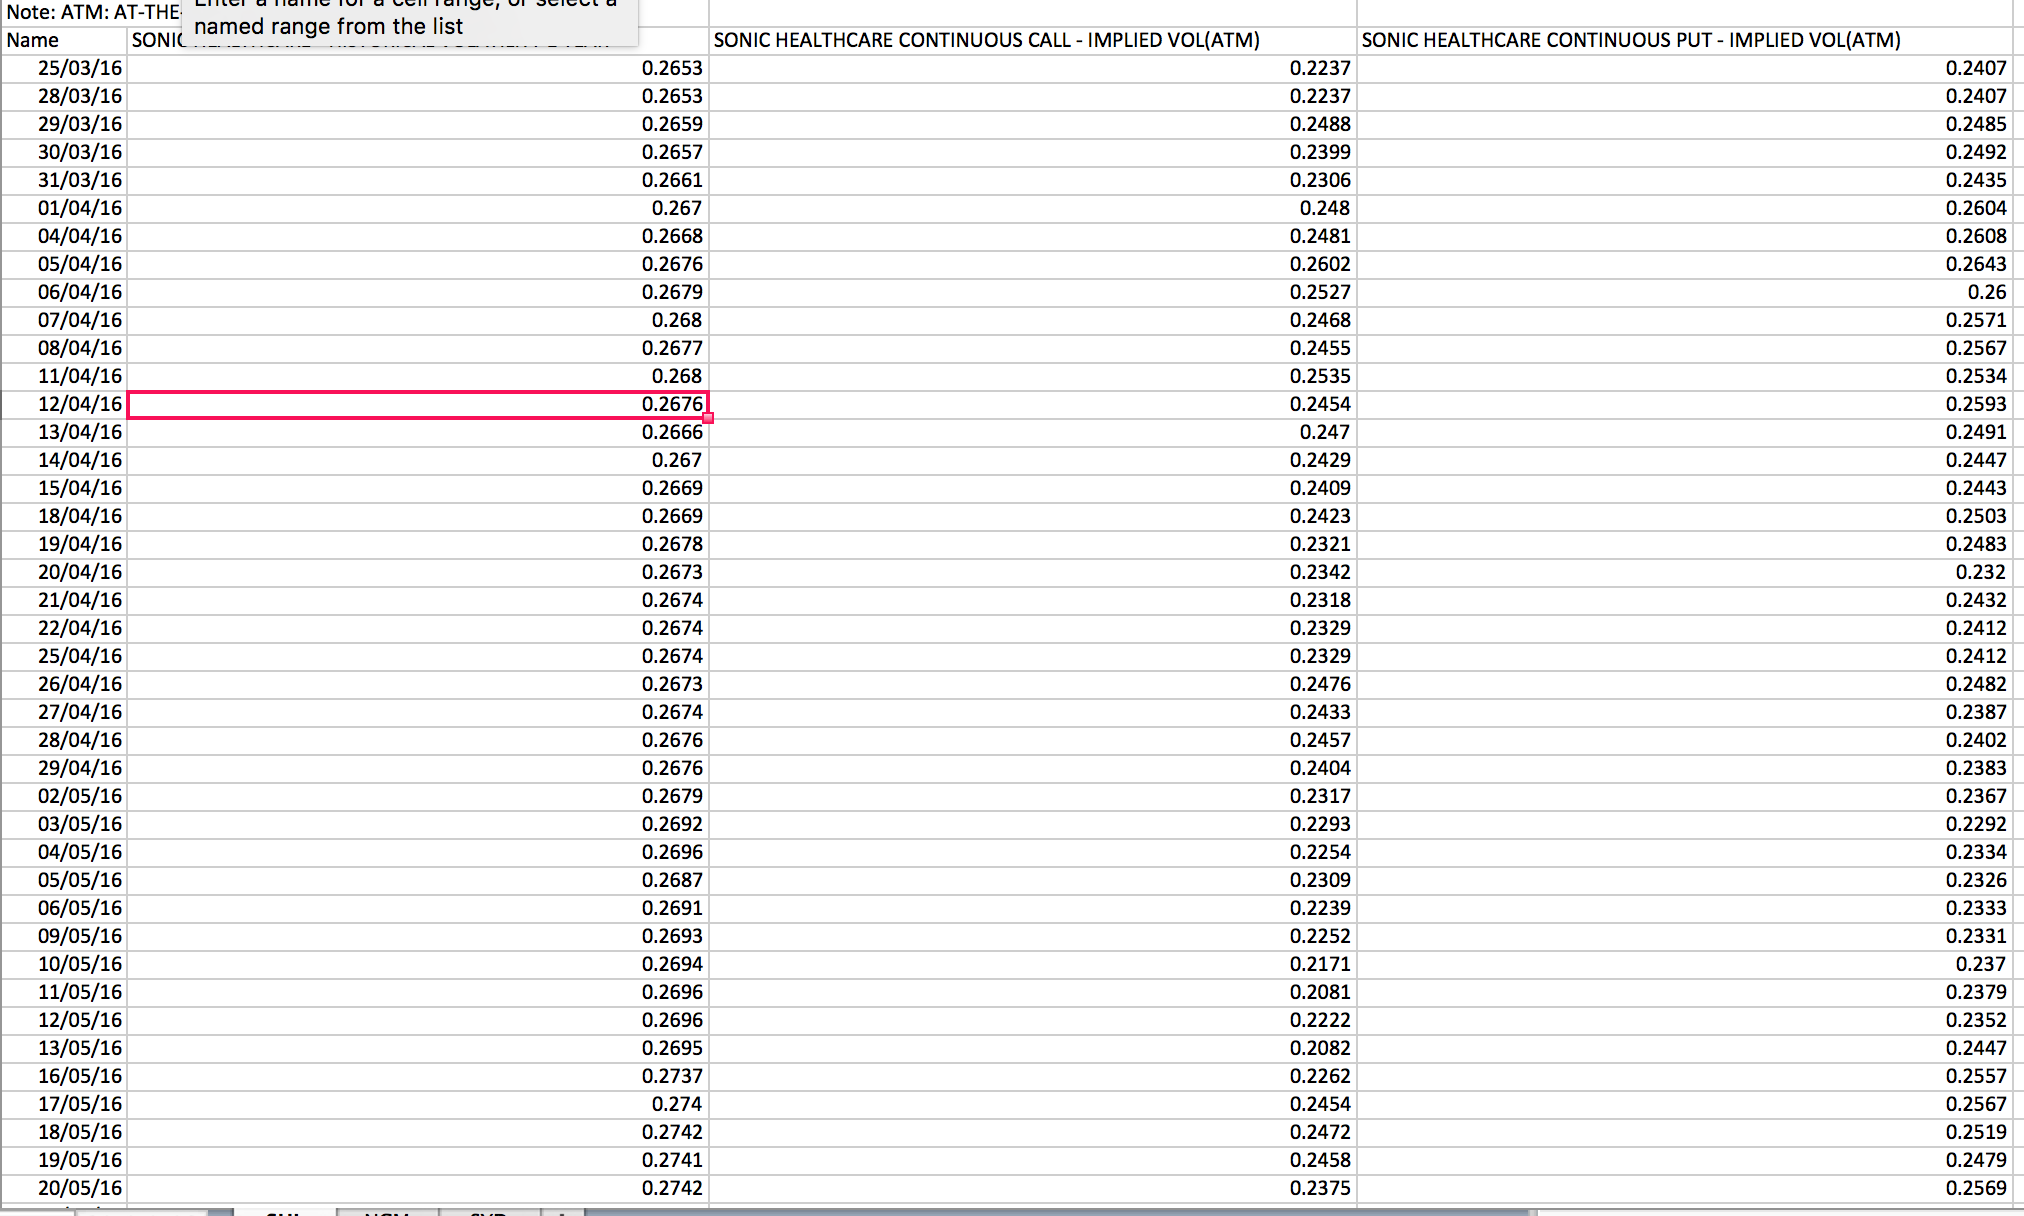
Question: How do i plot graph of historical volatility with 1 year implied volatility using given data as below? Stock Price of CALL DELTA CALL PRICE
How do i plot graph of historical volatility with 1 year implied volatility using given data as below?
Step by Step Solution
There are 3 Steps involved in it
1 Expert Approved Answer
Step: 1 Unlock

Question Has Been Solved by an Expert!
Get step-by-step solutions from verified subject matter experts
Step: 2 Unlock
Step: 3 Unlock