

Question: How do I plot only the highest LMF samples? Since CAS and LMF are in the same column (Location column) and CAS is the biggest
How do I plot only the highest LMF samples? Since CAS and LMF are in the same column (Location column) and CAS is the biggest value, its printing CAS values only for every HeatId. How do i diregard the CAS and Eaf values to only get LMF max values for every HeatId. Thanks,
What my code is right now:
SELECT [DateAndTime], [LabHeat], [Location] , [SampleNumber], [Fe], [Mn], [Si]
FROM [Meltshop].[dbo].[Chemistries]
WHERE ([DateAndTime]) IN (SELECT MAX([DateAndTime]) FROM [Meltshop].[dbo].[Chemistries] GROUP BY [LabHeat])
How it looks:
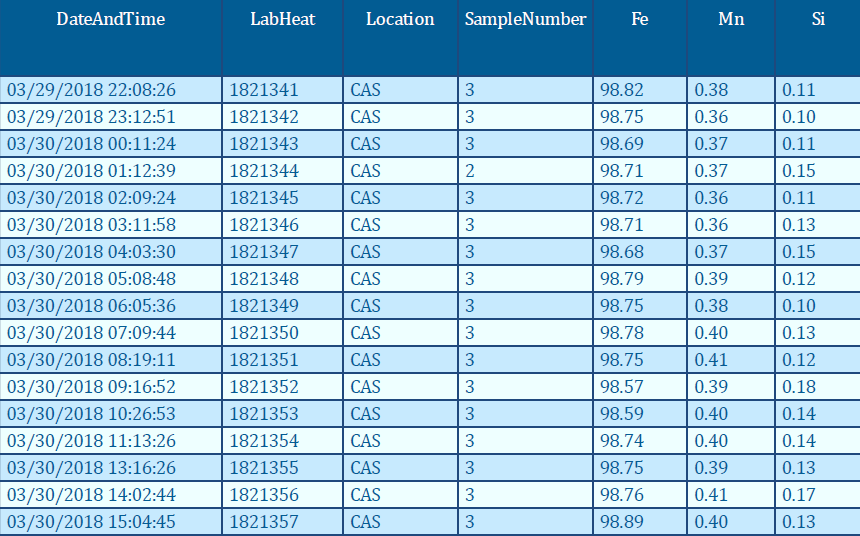
DateAndTime LabHeat Location SampleNumber 03/29/2018 22:08:26 03/29/2018 23:12:51 03/30/2018 00:11:24 03/30/2018 01:12:39 03/30/2018 02:09:24 03/30/2018 03:11:58 03/30/2018 04:03:30 03/30/2018 05:08:48 03/30/2018 06:05:36 03/30/2018 07:09:44 03/30/2018 08:19:11 03/30/2018 09:16:52 03/30/2018 10:26:53 03/30/2018 11:13:26 03/30/2018 13:16:26 03/30/2018 14:02:44 03/30/2018 15:04:45 1821341 1821342 1821343 1821344 1821345 1821346 1821347 1821348 1821349 1821350 1821351 1821352 1821353 1821354 1821355 1821356 1821357 98.82 98.75 98.69 98.71 98.72 98.71 98.68 98.79 98.75 98.78 98.75 98.57 98.59 98.74 98.75 98.76 98.89 0.38 0.36 0.37 0.37 0.36 0.36 0.37 0.39 0.38 0.40 0.41 0.39 0.40 0.40 0.39 0.41 0.40 0.11 0.10 0.11 0.15 0.11 0.13 0.15 0.12 0.10 0.13 0.12 0.18 0.14 0.14 0.13 0.17 0.13 3 3
Step by Step Solution
There are 3 Steps involved in it

Get step-by-step solutions from verified subject matter experts