Question: How do I set up the chart in excel, I need a step-step process. Thanks A new merchandise item in the store has no historical

How do I set up the chart in excel, I need a step-step process. ThanksHow do I set up the chart in excel, I need a

A new merchandise item in the store has no historical sales data. Since the demand for this item is price sensitive, the store manager is interested in figuring out what price will break even or make a profit. Simulating sales can help you realize the minimum number of items you need to sell in order to cover costs, given different price tags the store manager will put on the item. Price can vary between $20 and $30. Between 50 and 200 units are expected to sell within the first month. Fixed costs of monthly sales estimated to be $1,000 and cost per item is $15. Build a table for this problem and simulate all possible combinations of price and units sold. Use proper cell referencing to enter one formula and copy it to the entire table. For the number of units sold use 10 unit increments (50, 60, 70,...200). Properly label all data entries. Do not use a number in formulas. Use cell reference! B E F G H I J K L M N 1 C 1000 1 Fixed cost 2 Cost/unit D Price $ 20 $ 21 $ 22 $ 23 $ 24 $ 25 $ 26 $ 27 $ 28 $ 29 $ 30 100 110 120 130 140 150 Copy your worksheet to a second worksheet in the same file. Name this worksheet "Protected". Protect this sheet using password 123. Allow users to select and change prices and the number of units sold, but not any formula. Save and submit this file for grading

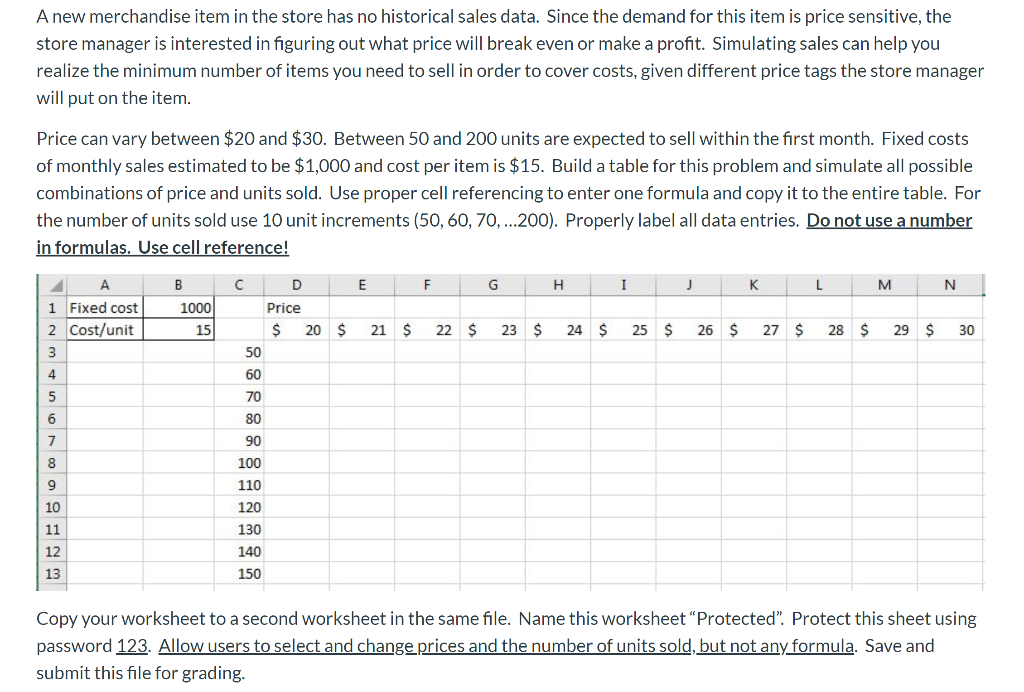
Step by Step Solution

There are 3 Steps involved in it

1 Expert Approved Answer
Step: 1 Unlock blur-text-image
Question Has Been Solved by an Expert!

Get step-by-step solutions from verified subject matter experts

Step: 2 Unlock
Step: 3 Unlock

Students Have Also Explored These Related General Management Questions!