

Question: how do I solve the chi-square test for this problem? I cant seem to solve it. I have the totals for each degree, and what
how do I solve the "chi-square test" for this problem? I cant seem to solve it. I have the totals for each degree, and what is expected to be the percentages. im confused. here is the question...
**what i know is that 40% of the students choose a Leadership major, 30% choose Finance, 20% choose Marketing, and 10% choose no major. Does the most recent class of 200 MBA students fit that same pattern or has there been a shift in the choice of majors. Using the sample of 200 students conduct a Chi Square Goodness of Fit test to determine if the current distribution fits the historical pattern.
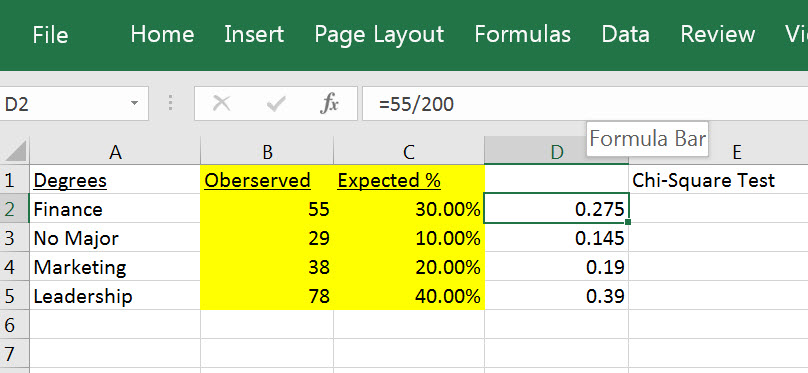
File Home Insert Page Layout Formulas Data Vi D2 X V fx =55/200 A B C D Formula Bar 1 Degrees Oberserved Expected % Chi-Square Test 2 Finance 55 30.00% 0.275 3 No Major 29 10.00% 0.145 4 Marketing 38 20.00% 0.19 5 Leadership 78 40.00% 0.39
Step by Step Solution
There are 3 Steps involved in it

Get step-by-step solutions from verified subject matter experts