

Question: Need help with this old exam question. It says that we should manipulate the data from this RMD file table to get the right answers.
Need help with this old exam question. It says that we should "manipulate the data" from this RMD file table to get the right answers. Please help!
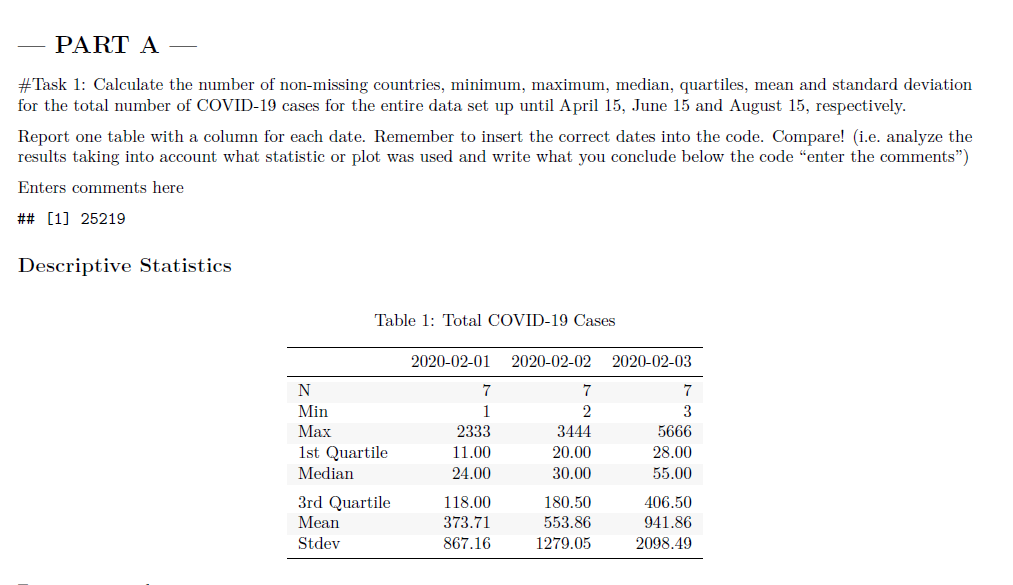
PART A #Task 1: Calculate the number of nonmissing countries, minimum, maximum, median, quartiles, mean and stande deviation for the total number of COVIDIQ cases for the entire data set up until April 15, June 15 and August 15, respectively. Report one table with a. column for each date. Remember to insert the correct dates into the code. Compare! [i.e. analyze the results taking into account What statistic or plot was used and write What you conclude below the code \"enter the comments") Enters comments here t [1] 25219 Descriptive Statistics Table 1: Total COVIDIQ Cases 20200201 20200202 20200203 N 7 7 7 Min 1 2 3 Max 2333 3444 5666 1st Quartile 11.00 20.00 2800 Median 24.00 30.00 55.00 3rd Quartile 118.00 180 .50 406.50 Mean 373.71 553.86 941.86 Stdev 867.16 1279 .05 2008.49
Step by Step Solution
There are 3 Steps involved in it

Get step-by-step solutions from verified subject matter experts