

Question: How do I solve the problem V in excel with a graph? You are required to use a financial calculator or spreadsheet (Excel) to solve
How do I solve the problem V in excel with a graph?
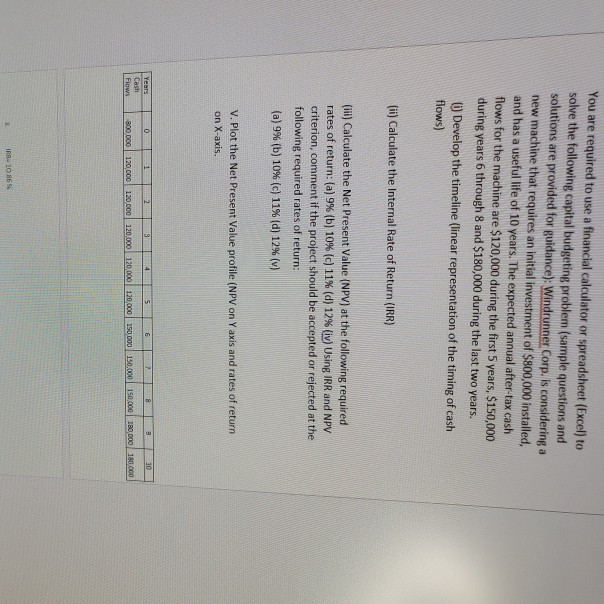
You are required to use a financial calculator or spreadsheet (Excel) to solve the following capital budgeting problem (sample questions and solutions are provided for guidance): Windrunner Corp. is considering a new machine that requires an initial investment of $800,000 installed, and has a useful life of 10 years. The expected annual after-tax cash flows for the machine are $120,000 during the first 5 years, $150,000 during years 6 through 8 and $180,000 during the last two years. U Develop the timeline (linear representation of the timing of cash flows) () Calculate the Internal Rate of Return (IRR) (ii)j Calculate the Net Present Value (NPV) at the following required rates of return: (a) 9% (b) 10% (c) 11% (d) 12% (iv) using IRR and NPV criterion, comment if the project should be accepted or rejected at the following required rates of return: (a) 9% (b) 10% (c) 11% (d) 12% (v) V. Plot the Net Present Value profile (NPV on Y axis and rates of return on X-axis. 10 158.000 180 000 180,00 Cash 900 000 120 Cc 120 00 120,000 120,000 120,00 150 000 10 IRR-10 86 %
Step by Step Solution
There are 3 Steps involved in it

Get step-by-step solutions from verified subject matter experts