

Question: How do I solve this Excel problem? Exercise: 1. Given the inputs below, fill in the projected costs in rows 28-34 with copyable formulas. 2.
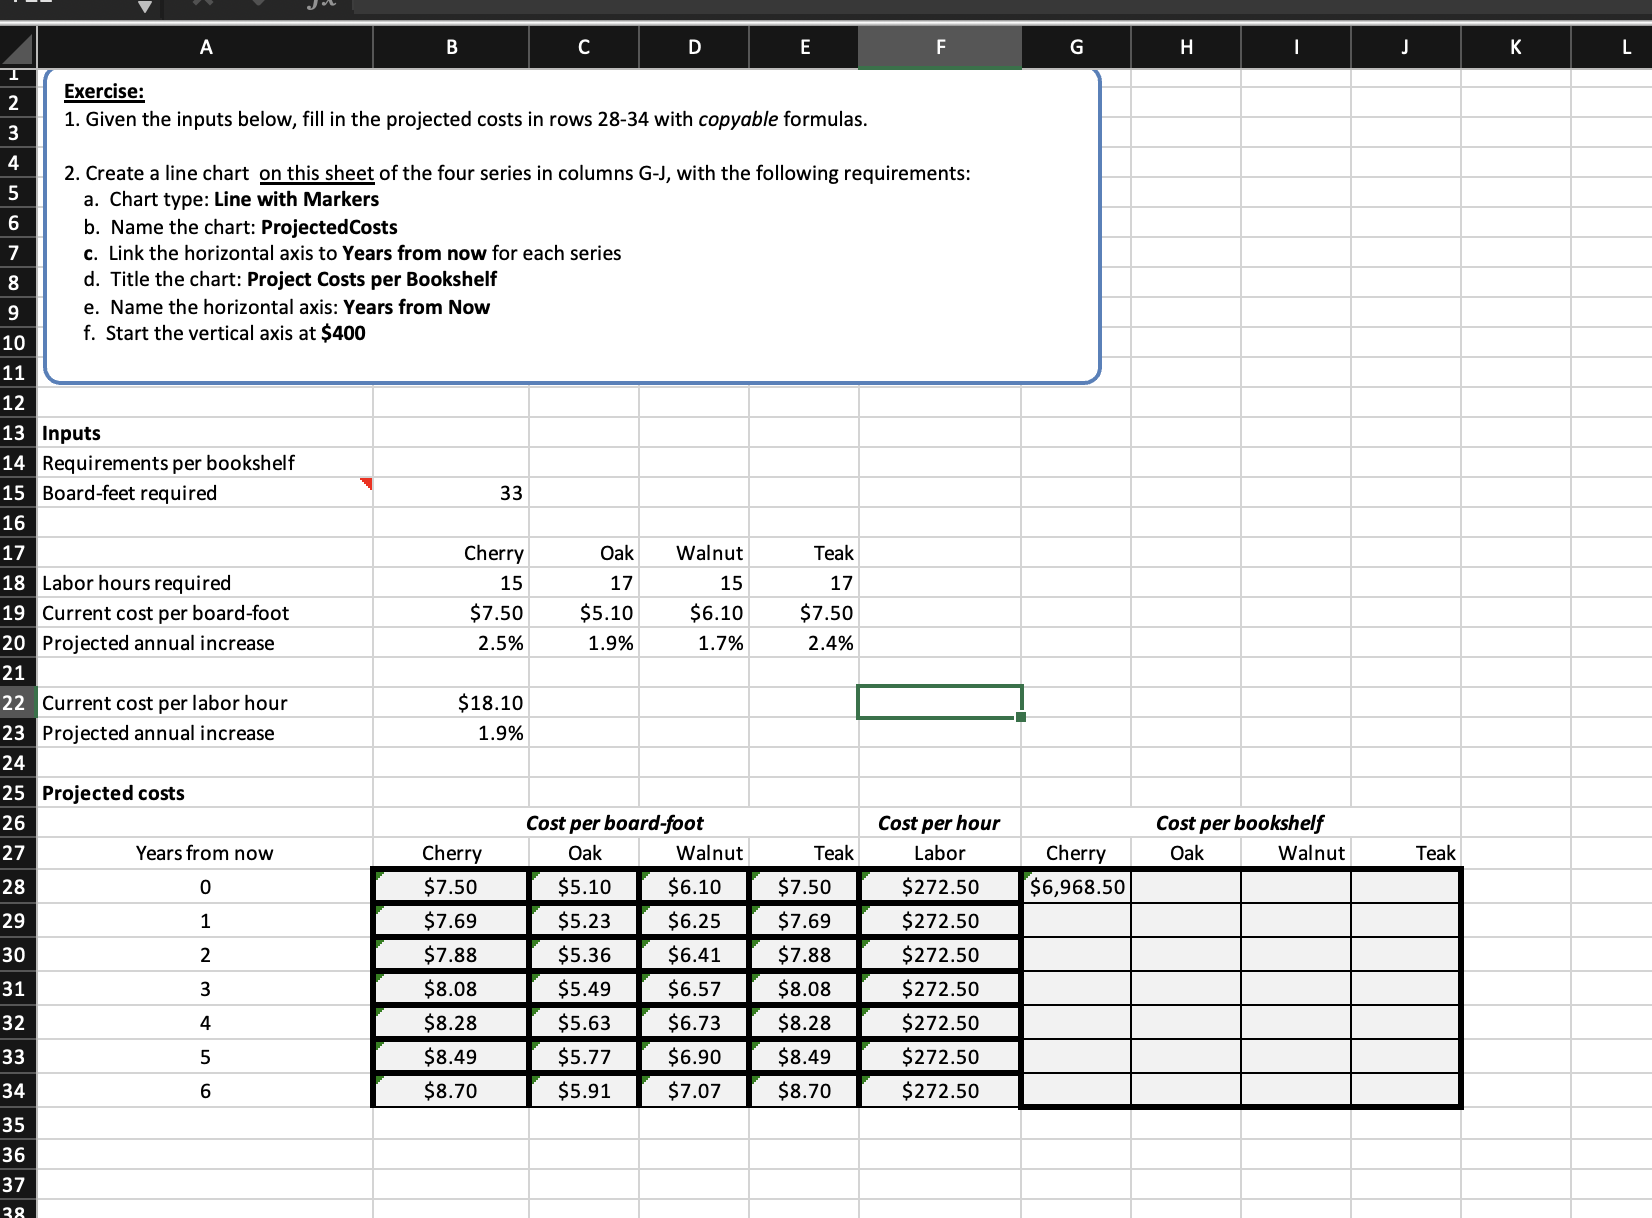
Exercise: 1. Given the inputs below, fill in the projected costs in rows 28-34 with copyable formulas. 2. Create a line chart on this sheet of the four series in columns G-J, with the following requirements: a. b. c. d. f. Chart type: Line with Markers Name the chart: ProjectedCosts Link the horizontal axis to Years from now for each series Title the chart: Project Costs per Bookshelf e. Name the horizontal axis: Years from Now Start the vertical axis at $400 10 11 12 13 14 15 16 17 18 19 21 22 23 24 25 26 27 28 29 30 31 32 33 34 35 36 37 Inputs Requirem ents per booksh elf Board-feet required Labor hours required Current cost per board-foot Projected annual increase Current cost per labor hour Projected annual increase Projected costs Years from now 1 2 3 4 5 6 33 Cherry 15 $7.50 2.5% $18.10 1.9% Cherry $7.50 $7.69 $7.88 $8.08 $8.28 $8.49 $8.70 Oak 17 $5.10 1.9% Walnut 15 $6.10 1.7% Cost per board-foot Teak 17 $7.50 2.4% Cost per hour Cost per bookshelf Oak $5.10 $5.23 $5.36 $5.49 $5.63 $5.77 $5.91 Walnut $6.10 $6.25 $6.41 $6.57 $6.73 $6.90 $7.07 Teak $7.50 $7.69 $7.88 $8.08 $8.28 $8.49 $8.70 Labor $272.50 $272.50 $272.50 $272.50 $272.50 $272.50 $272.50 Cherry Oak $6,968.50 Walnut Teak
Step by Step Solution
There are 3 Steps involved in it

Get step-by-step solutions from verified subject matter experts