

Question: how do I solve this? please show work. 2. {40 points] The following table contains the ACT scores and the GPA (grade point average) for
how do I solve this? please show work.
![how do I solve this? please show work. 2. {40 points] The](https://dsd5zvtm8ll6.cloudfront.net/si.experts.images/questions/2024/10/67115f5731ad3_76667115f56f265c.jpg)
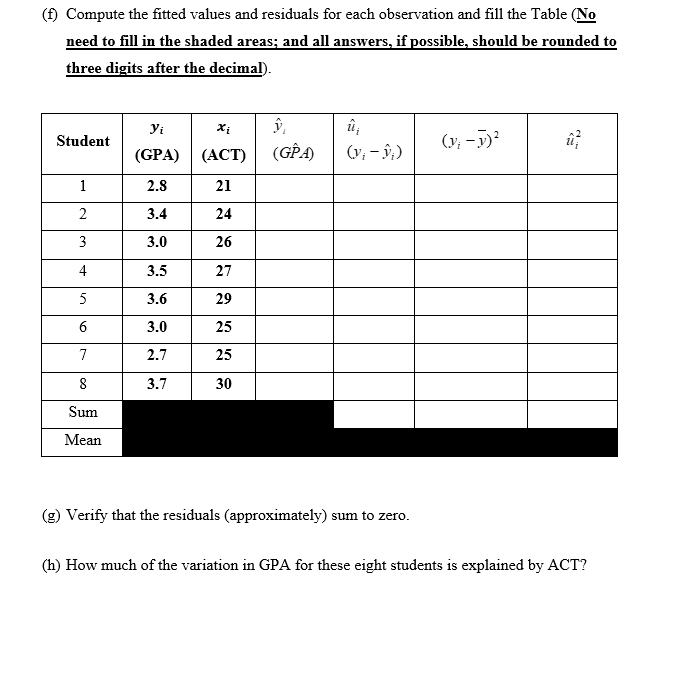
2. {40 points] The following table contains the ACT scores and the GPA (grade point average) for 8 college students. Note that grade point average is based on a fourpoint scale and has been rounded to one digit after the decimal gall answers: if Bossi'ble: should be rounded to three digits after the decimal\". (a) Fill the table (Ea need to ll in the shaded areas !. (b) Estimate the relationship between GPA and ACT using ULS; that is obtain the intercept and slope estimates in the equation GPA = 3:, + acr (e) Intetpret the intercept ( 30). an Intetpret the slope estimate ( 31). (e) What is the predicted value of GPA when ACT=3U? (f) Compute the tted values and residuals for each observation and ll the Table [E need to ll in the shaded areas; and all answers, iIEossible, should be rounded to three digits after the decimal I. (g) Verify that the residuals (approximately) sum to zero. (11) Haw much of the variation in GPA for these eight students is explained by ACT
Step by Step Solution
There are 3 Steps involved in it

Get step-by-step solutions from verified subject matter experts