

Question: How do I solve this? this is the excel file. The data file sweater.xls shows the quarterly sales of sweaters of a large apparel store
How do I solve this?
this is the excel file.
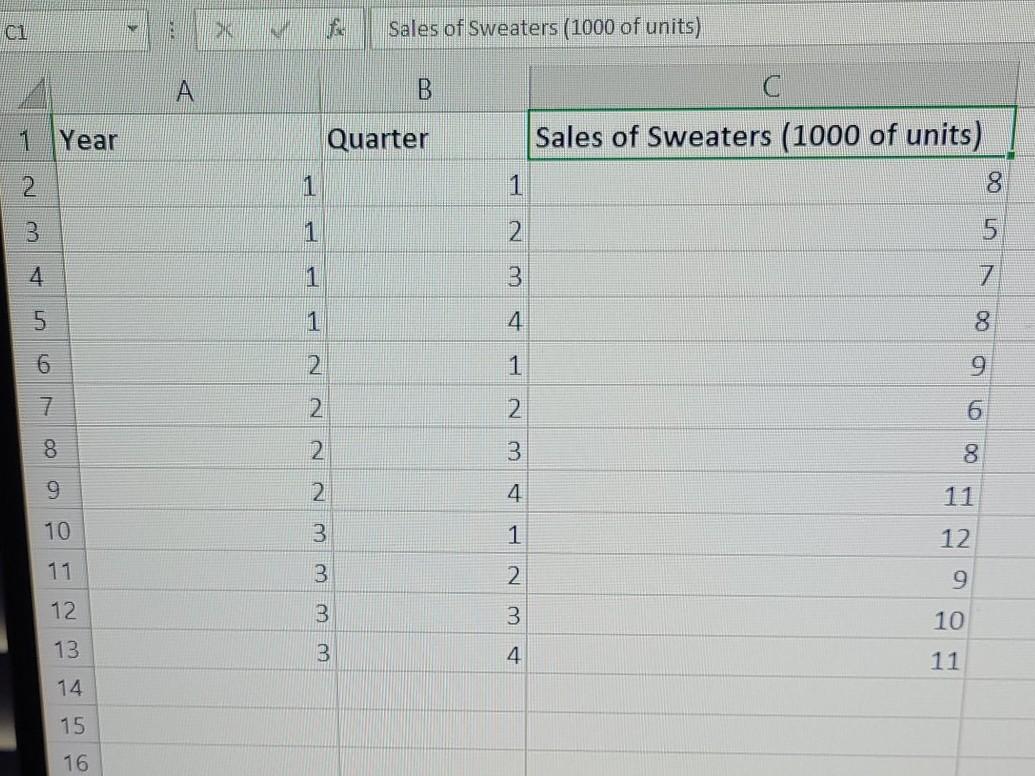
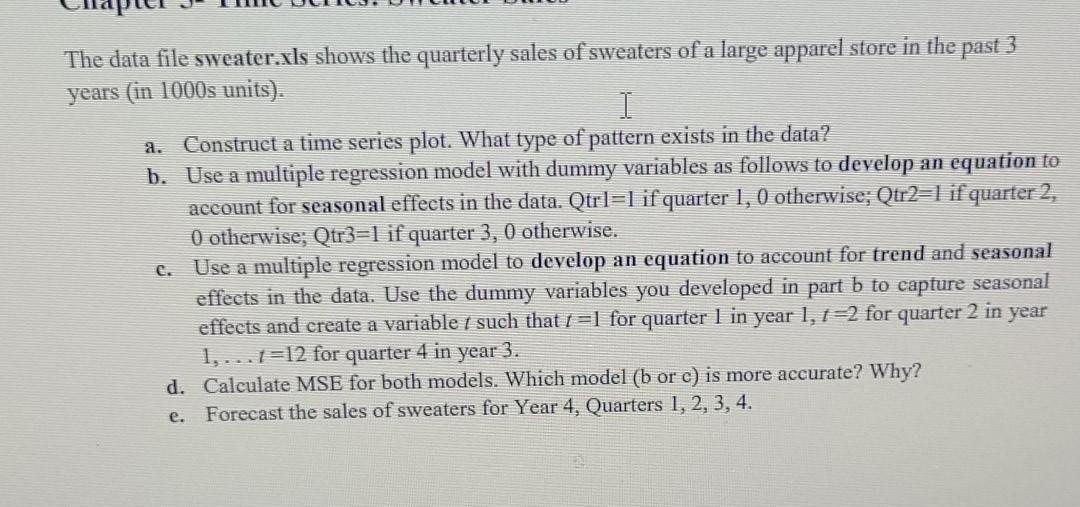
The data file sweater.xls shows the quarterly sales of sweaters of a large apparel store in the past 3 years (in 1000s units). 1 a. Construct a time series plot. What type of pattern exists in the data? b. Use a multiple regression model with dummy variables as follows to develop an equation to account for seasonal effects in the data. Qtrl=l if quarter 1, 0 otherwise; Qtr2=1 if quarter 2, 0 otherwise; Qtr3=lif quarter 3, 0 otherwise. c. Use a multiple regression model to develop an equation to account for trend and seasonal effects in the data. Use the dummy variables you developed in part b to capture seasonal effects and create a variable r such that I =] for quarter I in year 1, r=2 for quarter 2 in year 1, ...1=12 for quarter 4 in year 3. d. Calculate MSE for both models. Which model (b or c) is more accurate? Why? Forecast the sales of sweaters for Year 4, Quarters 1, 2, 3, 4. e. IN NO JE Sales of Sweaters (1000 of units) B 1 Year Quarter Sales of Sweaters (1000 of units) 2 1 1 8 3 1 2 5 4 1 3 7 1 4. 8 2 2 4 1 2 1 9 7 2 2 6 8 2. 3 8 9 N 4 10 3 12 1 2. 11 9 12 3 3 10 w w 13 4 11 14 15 16
Step by Step Solution
There are 3 Steps involved in it
1 Expert Approved Answer
Step: 1 Unlock

Question Has Been Solved by an Expert!
Get step-by-step solutions from verified subject matter experts
Step: 2 Unlock
Step: 3 Unlock