

Question: How do I work out the points for the regression lines for part 1: Q2. Go to the webpage Penn World Table 10.01 at https://www.
How do I work out the points for the regression lines for part 1: Q2.
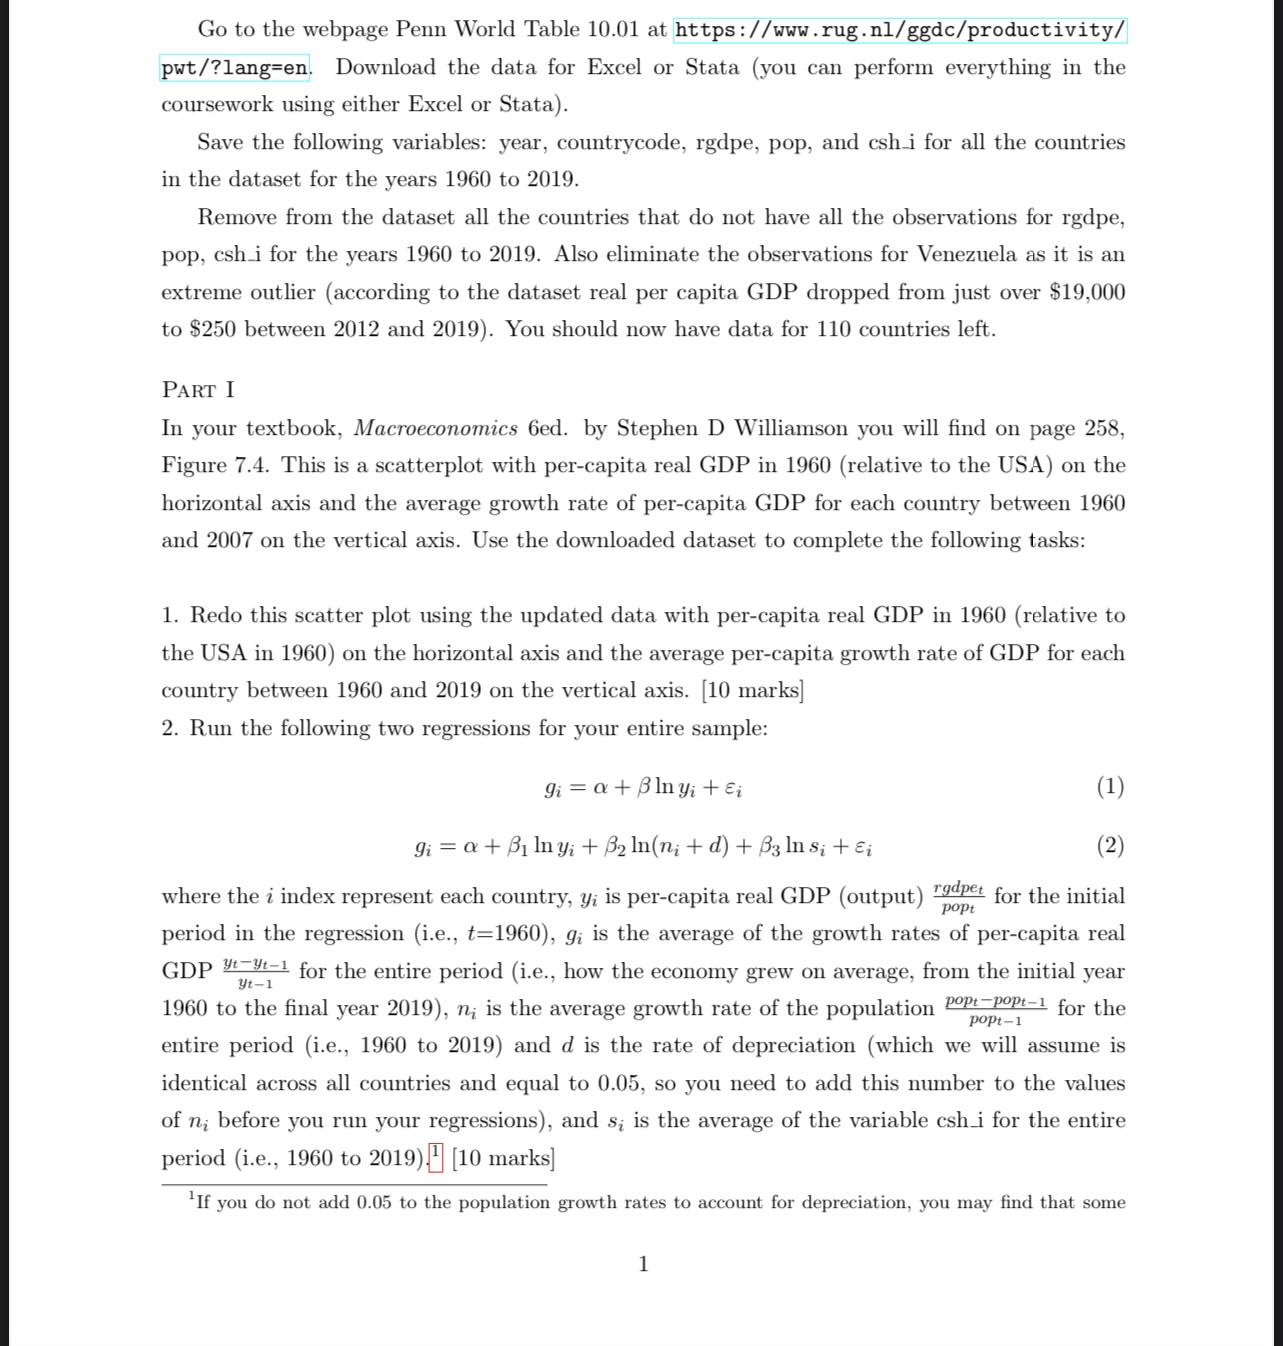
Go to the webpage Penn World Table 10.01 at https://www. rug . n1/ggdc/productivity/ pwt/?lang=en. Download the data for Excel or Stata (you can perform everything in the coursework using either Excel or Stata). Save the following variables: year, countrycode, redpe, pop, and cshi for all the countries in the dataset for the years 1960 to 2019. Remove from the dataset all the countries that do not have all the observations for redpe, pop, cshi for the years 1960 to 2019. Also eliminate the observations for Venezuela as it is an extreme outlier (according to the dataset real per capita GDP dropped from just over $19,000 to $250 between 2012 and 2019). You should now have data for 110 countries left. PART I In your textbook, Macroeconomics 6ed. by Stephen D Williamson you will find on page 258, Figure 7.4. This is a scatterplot with per-capita real GDP in 1960 (relative to the USA) on the horizontal axis and the average growth rate of per-capita GDP for each country between 1960 and 2007 on the vertical axis. Use the downloaded dataset to complete the following tasks: 1. Redo this scatter plot using the updated data with per-capita real GDP in 1960 (relative to the USA in 1960) on the horizontal axis and the average per-capita growth rate of GDP for each country between 1960 and 2019 on the vertical axis. [10 marks] 2. Run the following two regressions for your entire sample: gi = a + BInyi + Ei (1) gi = a + Bilny; + B2 In(n; + d) + 83 Ins; + Ei (2) where the i index represent each country, y; is per-capita real GDP (output) "gapet for the initial period in the regression (i.e., t=1960), gi is the average of the growth rates of per-capita real GDP ytyt-1 for the entire period (i.e., how the economy grew on average, from the initial year 1960 to the final year 2019), n; is the average growth rate of the population Opt-Dopt-1 for the popt-1 entire period (i.e., 1960 to 2019) and d is the rate of depreciation (which we will assume is identical across all countries and equal to 0.05, so you need to add this number to the values of ni before you run your regressions), and s; is the average of the variable cshi for the entire period (i.e., 1960 to 2019) 1 [10 marks] If you do not add 0.05 to the population growth rates to account for depreciation, you may find that some
Step by Step Solution
There are 3 Steps involved in it

Get step-by-step solutions from verified subject matter experts