

Question: how do you answer this with method, answer 1, pls help A homeware shop is evaluating its ordering policy for washing machines. Observed data shows
how do you answer this with method, answer 1, pls help
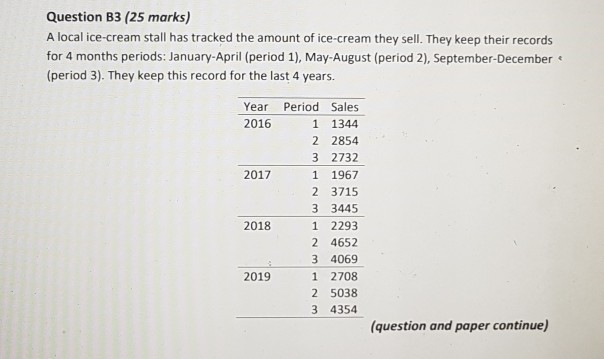
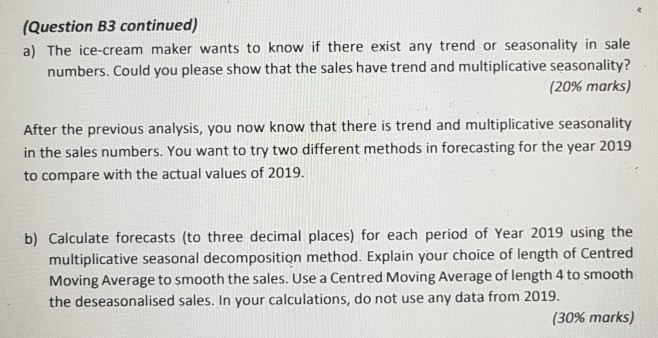
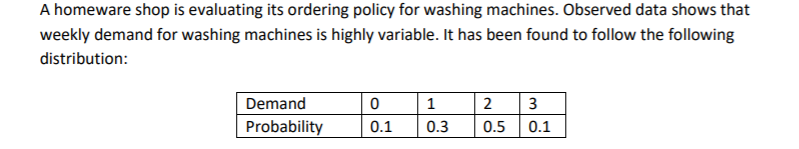
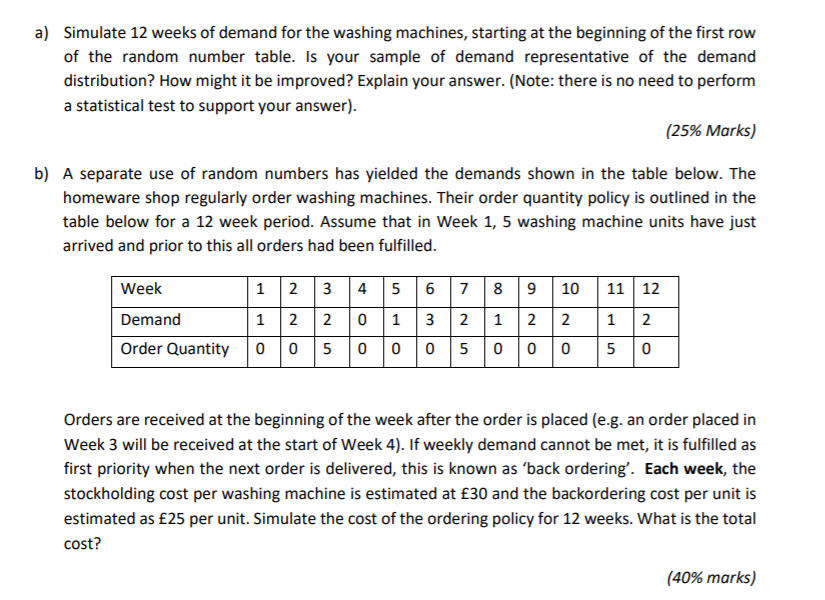
A homeware shop is evaluating its ordering policy for washing machines. Observed data shows that weekly demand for washing machines is highly variable. It has been found to follow the following distribution: Demand Probability 0 0.1 1 0.3 2 0.5 3 0.1 a) Simulate 12 weeks of demand for the washing machines, starting at the beginning of the first row of the random number table. Is your sample of demand representative of the demand distribution? How might it be improved? Explain your answer. (Note: there is no need to perform a statistical test to support your answer). (25% Marks) b) A separate use of random numbers has yielded the demands shown in the table below. The homeware shop regularly order washing machines. Their order quantity policy is outlined in the table below for a 12 week period. Assume that in Week 1, 5 washing machine units have just arrived and prior to this all orders had been fulfilled. Week 1 2 3 4 5 6 7 8 9 10 Demand 1 2 2 0 1 3 2 1 2 2 Order Quantity 0 0 5 0 0 0 5 0 0 0 11 12 1 2 5 0 Orders are received at the beginning of the week after the order is placed (e.g. an order placed in Week 3 will be received at the start of Week 4). If weekly demand cannot be met, it is fulfilled as first priority when the next order is delivered, this is known as back ordering'. Each week, the stockholding cost per washing machine is estimated at 30 and the backordering cost per unit is estimated as 25 per unit. Simulate the cost of the ordering policy for 12 weeks. What is the total cost? (40% marks) Question B3 (25 marks) A local ice-cream stall has tracked the amount of ice-cream they sell. They keep their records for 4 months periods: January-April (period 1), May-August (period 2), September-December (period 3). They keep this record for the last 4 years. Year 2016 2017 Period Sales 1 1344 2 2854 3 2732 1 1967 2 3715 3 3445 1 2293 24652 3 4069 1 2708 2 5038 3 4354 2018 2019 (question and paper continue) (Question B3 continued) a) The ice-cream maker wants to know if there exist any trend or seasonality in sale numbers. Could you please show that the sales have trend and multiplicative seasonality? (20% marks) After the previous analysis, you now know that there is trend and multiplicative seasonality in the sales numbers. You want to try two different methods in forecasting for the year 2019 to compare with the actual values of 2019. b) Calculate forecasts (to three decimal places) for each period of Year 2019 using the multiplicative seasonal decomposition method. Explain your choice of length of Centred Moving Average to smooth the sales. Use a Centred Moving Average of length 4 to smooth the deseasonalised sales. In your calculations, do not use any data from 2019. (30% marks) A homeware shop is evaluating its ordering policy for washing machines. Observed data shows that weekly demand for washing machines is highly variable. It has been found to follow the following distribution: Demand Probability 0 0.1 1 0.3 2 0.5 3 0.1 a) Simulate 12 weeks of demand for the washing machines, starting at the beginning of the first row of the random number table. Is your sample of demand representative of the demand distribution? How might it be improved? Explain your answer. (Note: there is no need to perform a statistical test to support your answer). (25% Marks) b) A separate use of random numbers has yielded the demands shown in the table below. The homeware shop regularly order washing machines. Their order quantity policy is outlined in the table below for a 12 week period. Assume that in Week 1, 5 washing machine units have just arrived and prior to this all orders had been fulfilled. Week 1 2 3 4 5 6 7 8 9 10 Demand 1 2 2 0 1 3 2 1 2 2 Order Quantity 0 0 5 0 0 0 5 0 0 0 11 12 1 2 5 0 Orders are received at the beginning of the week after the order is placed (e.g. an order placed in Week 3 will be received at the start of Week 4). If weekly demand cannot be met, it is fulfilled as first priority when the next order is delivered, this is known as back ordering'. Each week, the stockholding cost per washing machine is estimated at 30 and the backordering cost per unit is estimated as 25 per unit. Simulate the cost of the ordering policy for 12 weeks. What is the total cost? (40% marks) Question B3 (25 marks) A local ice-cream stall has tracked the amount of ice-cream they sell. They keep their records for 4 months periods: January-April (period 1), May-August (period 2), September-December (period 3). They keep this record for the last 4 years. Year 2016 2017 Period Sales 1 1344 2 2854 3 2732 1 1967 2 3715 3 3445 1 2293 24652 3 4069 1 2708 2 5038 3 4354 2018 2019 (question and paper continue) (Question B3 continued) a) The ice-cream maker wants to know if there exist any trend or seasonality in sale numbers. Could you please show that the sales have trend and multiplicative seasonality? (20% marks) After the previous analysis, you now know that there is trend and multiplicative seasonality in the sales numbers. You want to try two different methods in forecasting for the year 2019 to compare with the actual values of 2019. b) Calculate forecasts (to three decimal places) for each period of Year 2019 using the multiplicative seasonal decomposition method. Explain your choice of length of Centred Moving Average to smooth the sales. Use a Centred Moving Average of length 4 to smooth the deseasonalised sales. In your calculations, do not use any data from 2019. (30% marks)
Step by Step Solution
There are 3 Steps involved in it
1 Expert Approved Answer
Step: 1 Unlock

Question Has Been Solved by an Expert!
Get step-by-step solutions from verified subject matter experts
Step: 2 Unlock
Step: 3 Unlock